
 | ||
In astronomy, a light curve is a graph of light intensity of a celestial object or region, as a function of time. The light is usually in a particular frequency interval or band. Light curves can be periodic, as in the case of eclipsing binaries, Cepheid variables, other periodic variables, and transiting extrasolar planets, or aperiodic, like the light curve of a nova, a cataclysmic variable star, a supernova or a microlensing event. The study of the light curve, together with other observations, can yield considerable information about the physical process that produces it or constrain the physical theories about it. Light waves can also be used in botany to determine a plant's reactions to light intensities.
Contents
Astronomy
In astronomy, light curves from a supernova are used to determine what type of supernova it is. If the supernova's light curve has a sharp maximum and slopes down gradually, then it is a type I supernova. If the supernova's light curve has a less sharp maximum, slopes down quickly, and then levels off, it is a type II supernova.
Planetary astronomy
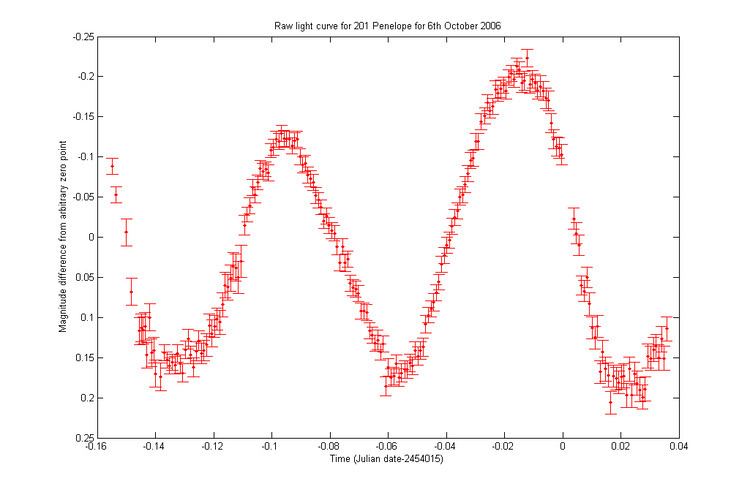
In planetary science, a light curve can be used to estimate the rotation period of a minor planet, moon, or comet nucleus. From the Earth there is often no way to resolve a small object in the Solar System, even in the most powerful of telescopes, since the apparent angular size of the object is smaller than one pixel in the detector. Thus, astronomers measure the amount of light produced by an object as a function of time (the light curve). The time separation of peaks in the light curve gives an estimate of the rotational period of the object. The difference between the maximum and minimum brightnesses (the amplitude of the light curve) can be due to the shape of the object, or to bright and dark areas on its surface. For example, an asymmetrical asteroid's light curve generally has more pronounced peaks, while a more spherical object's light curve will be flatter.
Light curve quality code
The Asteroid Lightcurve Database (LCDB) of the Collaborative Asteroid Lightcurve Link (CALL) uses a numeric code to assess the quality of a period solution for minor planet light curves (it does not necessarily assess the actual underlying data). Its quality code parameter "U" ranges from 0 (incorrect) to 3 (well-defined):
A trailing plus sign (+) or minus sign (-) is also used to indicate a slightly better or worse quality than the unsigned value.
Botany
In botany, a light curve shows the photosynthetic response of leaf tissue or algal communities to varying light intensities. The shape of the curve illustrates the principle of limiting factors; in low light levels, the rate of photosynthesis is limited by the concentration of chlorophyll and the efficiency of the light-dependent reactions, but in higher light levels it is limited by the efficiency of RuBisCo and the availability of carbon dioxide. The point on the curve where these two differing slopes meet is called the light saturation point and is where the light-dependent reactions are producing more ATP and NADPH than can be utilized by the light-independent reactions. Since photosynthesis is also limited by ambient carbon dioxide levels, light curves are often repeated at several different constant carbon dioxide concentrations.