
 | ||
The K-index quantifies disturbances in the horizontal component of earth's magnetic field with an integer in the range 0–9 with 1 being calm and 5 or more indicating a geomagnetic storm. It is derived from the maximum fluctuations of horizontal components observed on a magnetometer during a three-hour interval. The label K comes from the German word Kennziffer meaning “characteristic digit”. The K-index was introduced by Julius Bartels in 1938.
Contents
Calculation of K-index
The K-scale is quasi-logarithmic. The conversion table from maximum fluctuation R (in units of nanoteslas, nT) to K-index, varies from observatory to observatory in such a way that the historical rate of occurrence of certain levels of K are about the same at all observatories. In practice this means that observatories at higher geomagnetic latitude require higher levels of fluctuation for a given K-index. For example, at Godhavn, Greenland, a value of K = 9 is derived with R = 1500 nT, while in Honolulu, Hawaii, a fluctuation of only 300 nT is recorded as K = 9. In Kiel, Germany, K = 9 corresponds to R = 500 nT or greater. The real-time K-index is determined after the end of prescribed intervals of 3 hours each: 00:00–03:00, 03:00–06:00, ..., 21:00–24:00. The maximum positive and negative deviations during the 3 hour period are added together to determine the total maximum fluctuation. These maximum deviations may occur any time during the 3 hour period.
The Kp index and estimated Kp index
The official planetary Kp index is derived by calculating a weighted average of K indices from a network of geomagnetic observatories. Since these observatories do not report their data in real-time, various operations centers around the globe estimate the index based on data available from their local network of observatories. The Kp-index was introduced by Bartels in 1939.
The relationship between K and A
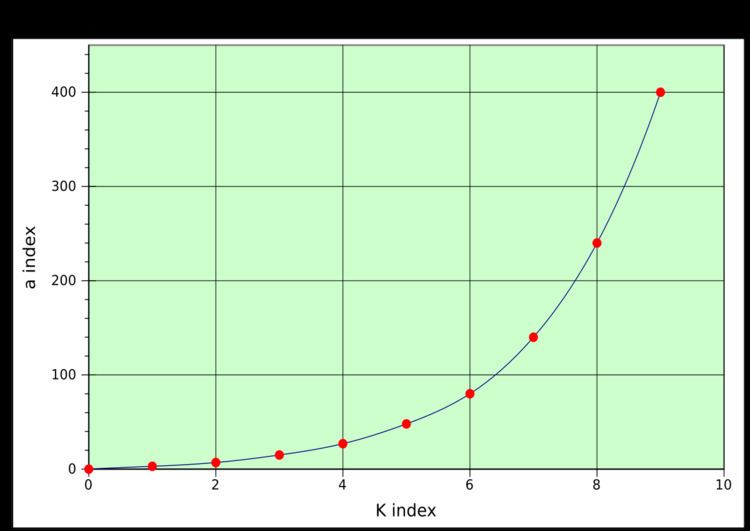
The A index provides a daily average level for geomagnetic activity. Because of the non-linear relationship of the K-scale to magnetometer fluctuations, it is not meaningful to take the average of a set of K indices. What is done instead is to convert each K back into a linear scale called the "equivalent three hourly range" a-index (note the lower case ‘a’), according to the following table:
The daily A-index is merely the average of eight ‘a’ indices.
Thus, for example, if the K indices for the day were 3, 4, 6, 5, 3, 2, 2 and 1, the daily A-index is the average of the equivalent amplitudes:
A = (15 + 27 + 80 + 48 + 15 + 7 + 7 + 4)/8 = 25.38The Ap index is averaged planetary A-index based on data from a set of specific Kp stations.
The relationship between the NOAA G-scale and Kp
The Kp-scale is a reasonable way to summarize the global level of geomagnetic activity, but it has not always been easy for those affected by the space environment to understand its significance. The NOAA G-scale was designed to correspond, in a straightforward way, to the significance of effects of geomagnetic storms.
Use in radio propagation studies
The Kp index is used for the study and prediction of ionospheric propagation of high frequency radio signals. Geomagnetic storms, indicated by a Kp = 5 or higher, have no direct effect on propagation. However they disturb the F-layer of the ionosphere, especially at middle and high geographical latitudes, causing a so-called ionospheric storm which degrades radio propagation. The degradation mainly consists of a reduction of the maximum usable frequency (MUF) by as much as 50%. Sometimes the E-layer may be affected as well. In contrast with sudden ionospheric disturbances (SID), which affect high frequency radio paths near the Equator, the effects of ionospheric storms are more intense in the polar regions.