
 | ||
Item tree analysis (ITA) is a data analytical method which allows constructing a hierarchical structure on the items of a questionnaire or test from observed response patterns.
Assume that we have a questionnaire with m items and that subjects can answer positive (1) or negative (0) to each of these items, i.e. the items are dichotomous. If n subjects answer the items this results in a binary data matrix D with m columns and n rows. Typical examples of this data format are test items which can be solved (1) or failed (0) by subjects. Other typical examples are questionnaires where the items are statements to which subjects can agree (1) or disagree (0).
Depending on the content of the items it is possible that the response of a subject to an item j determines her or his responses to other items. It is, for example, possible that each subject who agrees to item j will also agree to item i. In this case we say that item j implies item i (short
Contents
Algorithms for ITA
ITA was originally developed by Van Leeuwe in 1974. The result of his algorithm, which we refer in the following as Classical ITA, is a logically consistent set of implications
A different algorithm to perform an ITA was suggested in Schrepp (1999). This algorithm is called Inductive ITA.
Classical ITA and inductive ITA both construct a quasi-order on the item set by explorative data analysis. But both methods use a different algorithm to construct this quasi-order. For a given data set the resulting quasi-orders from classical and inductive ITA will usually differ.
A detailed description of the algorithms used in classical and inductive ITA can be found in Schrepp (2003) or Schrepp (2006)[1]. In a recent paper (Sargin & Ünlü, 2009) some modifications to the algorithm of inductive ITA are proposed, which improve the ability of this method to detect the correct implications from data (especially in the case of higher random response error rates).
Relation to other methods
ITA belongs to a group of data analysis methods called Boolean analysis of questionnaires. Boolean analysis was introduced by Flament in 1976. The goal of a Boolean analysis is to detect deterministic dependencies (formulas from Boolean logic connecting the items, like for example
Applications
There are several research papers available, which describe concrete applications of item tree analysis. Held and Korossy (1998) analyzes implications on a set of algebra problems with classical ITA. Item tree analysis is also used in a number of social science studies to get insight into the structure of dichotomous data. In Bart and Krus (1973), for example, a predecessor of ITA is used to establish a hierarchical order on items that describe socially unaccepted behavior. In Janssens (1999) a method of Boolean analysis is used to investigate the integration process of minorities into the value system of the dominant culture. Schrepp describes several applications of inductive ITA in the analysis of dependencies between items of social science questionnaires.
Example of an application
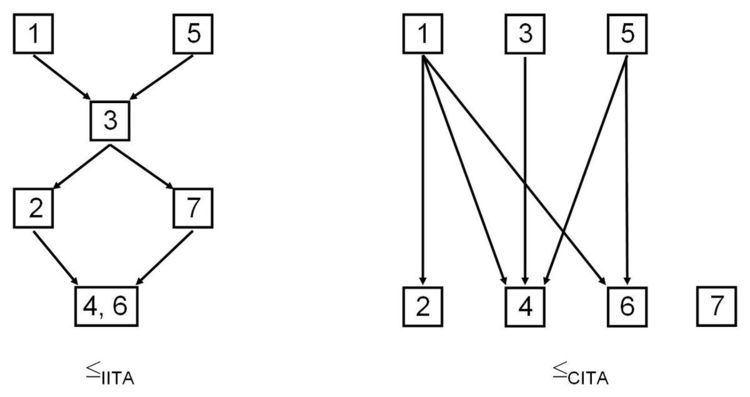
To show the possibilities of an analysis of a data set by ITA we analyse the statements of question 4 of the International Social Science Survey Programme (ISSSP) for the year 1995 by inductive and classical ITA. The ISSSP is a continuing annual program of cross-national collaboration on surveys covering important topics for social science research. The program conducts each year one survey with comparable questions in each of the participating nations. The theme of the 1995 survey was national identity. We analyze the results for question 4 for the data set of Western Germany. The statement for question 4 was:
Some people say the following things are important for being truly German. Others say they are not important. How important do you think each of the following is:
1. to have been born in Germany
2. to have German citizenship
3. to have lived in Germany for most of one’s life
4. to be able to speak German
5. to be a Christian
6. to respect Germany’s political institutions
7. to feel German
The subjects had the response possibilities Very important, Important, Not very important, Not important at all, and Can’t choose to answer the statements. To apply ITA to this data set we changed the answer categories.
Very important and Important are coded as 1. Not very important and Not important at all are coded as 0. Can’t choose was handled as missing data.
The following figure shows the resulting quasi-orders
Available software
The program ITA 2.0 implements both classical and inductive ITA. The program is available on [2]. A short documentation of the program is available in [3].