
 | ||
In engineering, an influence line graphs the variation of a function (such as the shear felt in a structure member) at a specific point on a beam or truss caused by a unit load placed at any point along the structure. Some of the common functions studied with influence lines include reactions (the forces that the structure’s supports must apply in order for the structure to remain static), shear, moment, and deflection. Influence lines are important in designing beams and trusses used in bridges, crane rails, conveyor belts, floor girders, and other structures where loads will move along their span. The influence lines show where a load will create the maximum effect for any of the functions studied.
Contents
- Demonstration from Bettis theorem
- Concept
- Methods for constructing influence lines
- Tabulate values
- Influence line equations
- Mller Breslaus Principle
- Multiple loads
- Distributed loads
- Indeterminate structures
- References
Influence lines are both scalar and additive. This means that they can be used even when the load that will be applied is not a unit load or if there are multiple loads applied. To find the effect of any non-unit load on a structure, the ordinate results obtained by the influence line are multiplied by the magnitude of the actual load to be applied. The entire influence line can be scaled, or just the maximum and minimum effects experienced along the line. The scaled maximum and minimum are the critical magnitudes that must be designed for in the beam or truss.
In cases where multiple loads may be in effect, the influence lines for the individual loads may be added together in order to obtain the total effect felt by the structure at a given point. When adding the influence lines together, it is necessary to include the appropriate offsets due to the spacing of loads across the structure. For example, a truck load is applied to the structure. Rear axle, B, is three feet behind front axle, A, then the effect of A at x feet along the structure must be added to the effect of B at (x – 3) feet along the structure—not the effect of B at x feet along the structure.
Many loads are distributed rather than concentrated. Influence lines can be used with either concentrated or distributed loadings. For a concentrated (or point) load, a unit point load is moved along the structure. For a distributed load of a given width, a unit-distributed load of the same width is moved along the structure, noting that as the load nears the ends and moves off the structure only part of the total load is carried by the structure. The effect of the distributed unit load can also be obtained by integrating the point load’s influence line over the corresponding length of the structures.
Demonstration from Betti's theorem
Influence lines are based on Betti's theorem. From there, consider two external force systems,
Consider that the
Concept
When designing a beam or truss, it is necessary to design for the scenarios causing the maximum expected reactions, shears, and moments within the structure members in order to ensure that no member will fail during the life of the structure. When dealing with dead loads (loads that never move, such as the weight of the structure itself), this is relatively easy because the loads are easy to predict and plan for. For live loads (any load that will be moved during the life of the structure, such as furniture and people), it becomes much harder to predict where the loads will be or how concentrated or distributed they will be throughout the life of the structure.
Influence lines graph the response of a beam or truss as a unit load travels across it. The influence line allows the designers to discover quickly where to place a live load in order to calculate the maximum resulting response for each of the following functions: reaction, shear, or moment. The designer can then scale the influence line by the greatest expected load to calculate the maximum response of each function for which the beam or truss must be designed. Influence lines can also be used to find the responses of other functions (such as deflection or axial force) to the applied unit load, but these uses of influence lines are less common.
Methods for constructing influence lines
There are three methods used for constructing the influence line. The first is to tabulate the influence values for multiple points along the structure, then use those points to create the influence line. The second is to determine the influence-line equations that apply to the structure, thereby solving for all points along the influence line in terms of x, where x is the number of feet from the start of the structure to the point where the unit load is applied. The third method is called the Müller-Breslau's principle. It creates a qualitative influence line. This influence line will still provide the designer with an accurate idea of where the unit load will produce the largest response of a function at the point being studied, but it cannot be used directly to calculate what the magnitude that response will be, whereas the influence lines produced by the first two methods can.
Tabulate values
In order to tabulate the influence values with respect to some point A on the structure, a unit load must be placed at various points along the structure. Statics is used to calculate what the value of the function (reaction, shear, or moment) is at point A. Typically an upwards reaction is seen as positive. Shear and moments are given positive or negative values according to the same conventions used for shear and moment diagrams.
R. C. Hibbeler states, in his book Structural Analysis, “All statically determinate beams will have influence lines that consist of straight line segments.” Therefore, it is possible to minimize the number of computations by recognizing the points that will cause a change in the slope of the influence line and only calculating the values at those points. The slope of the inflection line can change at supports, mid-spans, and joints.
An influence line for a given function, such as a reaction, axial force, shear force, or bending moment, is a graph that shows the variation of that function at any given point on a structure due to the application of a unit load at any point on the structure.
An influence line for a function differs from a shear, axial, or bending moment diagram. Influence lines can be generated by independently applying a unit load at several points on a structure and determining the value of the function due to this load, i.e. shear, axial, and moment at the desired location. The calculated values for each function are then plotted where the load was applied and then connected together to generate the influence line for the function.
Once the influence values have been tabulated, the influence line for the function at point A can be drawn in terms of x. First, the tabulated values must be located. For the sections in between the tabulated points, interpolation is required. Therefore, straight lines may be drawn to connect the points. Once this is done, the influence line is complete.
Influence-line equations
It is possible to create equations defining the influence line across the entire span of a structure. This is done by solving for the reaction, shear, or moment at the point A caused by a unit load placed at x feet along the structure instead of a specific distance. This method is similar to the tabulated values method, but rather than obtaining a numeric solution, the outcome is an equation in terms of x.
It is important to understanding where the slope of the influence line changes for this method because the influence-line equation will change for each linear section of the influence line. Therefore, the complete equation will be a piecewise linear function which has a separate influence-line equation for each linear section of the influence line.
Müller-Breslau's Principle
According to www.public.iastate.edu, “The Müller-Breslau Principle can be utilized to draw qualitative influence lines, which are directly proportional to the actual influence line.” Instead of moving a unit load along a beam, the Müller-Breslau Principle finds the deflected shape of the beam caused by first releasing the beam at the point being studied, and then applying the function (reaction, shear, or moment) being studied to that point. The principle states that the influence line of a function will have a scaled shape that is the same as the deflected shape of the beam when the beam is acted upon by the function.
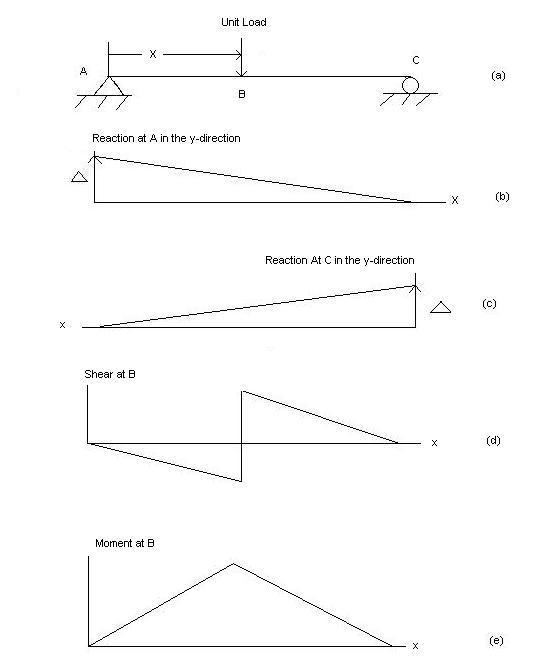
In order to understand how the beam will deflect under the function, it is necessary to remove the beam’s capacity to resist the function. Below are explanations of how to find the influence lines of a simply supported, rigid beam (such as the one displayed in Figure 1).
The Müller-Breslau Principle can only produce qualitative influence lines. This means that engineers can use it to determine where to place a load to incur the maximum of a function, but the magnitude of that maximum cannot be calculated from the influence line. Instead, the engineer must use statics to solve for the functions value in that loading case.
Multiple loads
The simplest loading case is a single point load, but influence lines can also be used to determine responses due to multiple loads and distributed loads. Sometimes it is known that multiple loads will occur at some fixed distance apart. For example, on a bridge the wheels of cars or trucks create point loads that act at relatively standard distances.
In order to calculate the response of a function to all of these point loads using an influence line, the results found with the influence line can be scaled for each load, and then the scaled magnitudes can be summed to find the total response that the structure must withstand. The point loads can have different magnitudes themselves, but even if they apply the same force to the structure, it will be necessary to scale them separately because they act at different distances along the structure. For example, if a car's wheels are 10 feet apart, then when the first set is 13 feet onto the bridge, the second set will be only 3 feet onto the bridge. If the first set of wheels is 7 feet onto the bridge, the second set has not yet reached the bridge, and therefore only the first set is placing a load on the bridge.
Also, if, between two loads, one of the loads is heavier, the loads must be examined in both loading orders (the larger load on the right and the larger load on the left) to ensure that the maximum load is found. If there are three or more loads, then the number of cases to be examined will increase.
Distributed loads
Many loads do not act as point loads, but instead act over an extended length or area as distributed loads. For example, a tractor with continuous tracks will apply a load distributed over the length of each track.
In order to find the effect of a distributed load, the designer can integrate an influence line, found using a point load, over the affected distance of the structure. For example, if a three-foot-long track acts between 5 feet and 8 feet along a beam, the influence line of that beam must be integrated between 5 and 8 feet. The integration of the influence line gives the effect that would be felt if the distributed load had a unit magnitude. Therefore, after integrating, the designer must still scale the results to get the actual effect of the distributed load.
Indeterminate structures
While the influence lines of statically determinate structures (as mentioned above) are made up of straight line segments, the same is not true for indeterminate structures. Indeterminate structures are not considered rigid; therefore, the influence lines drawn for them will not be straight lines but rather curves. The methods above can still be used to determine the influence lines for the structure, but the work becomes much more complex as the properties of the beam itself must be taken into consideration.