
 | ||
In economics, an indifference curve connects points on a graph representing different quantities of two goods, points between which a consumer is indifferent. That is, the consumer has no preference for one combination or bundle of goods over a different combination on the same curve. One can also refer to each point on the indifference curve as rendering the same level of utility (satisfaction) for the consumer. In other words, an indifference curve is the locus of various points showing different combinations of two goods providing equal utility to the consumer. Utility is then a device to represent preferences rather than something from which preferences come. The main use of indifference curves is in the representation of potentially observable demand patterns for individual consumers over commodity bundles.
Contents
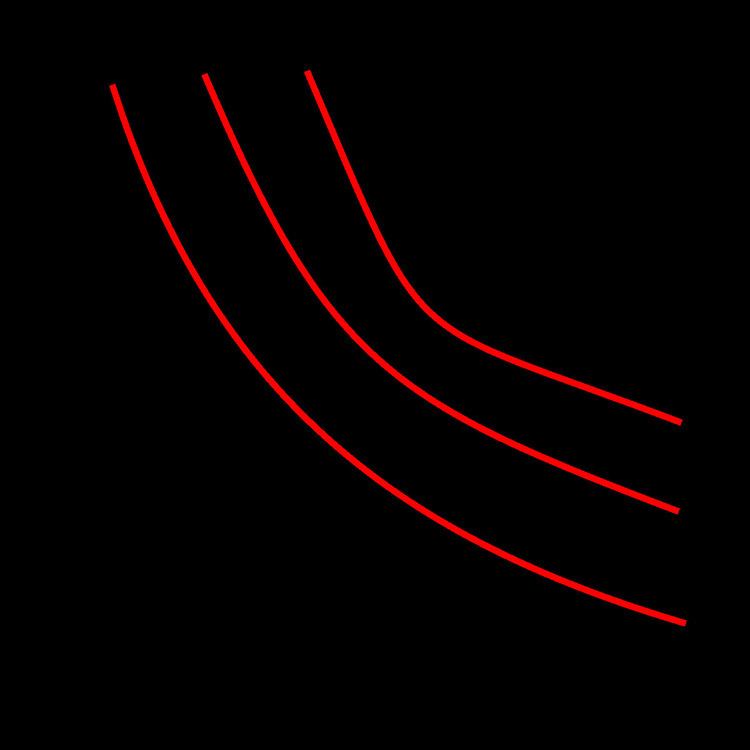
There are infinitely many indifference curves: one passes through each combination. A collection of (selected) indifference curves, illustrated graphically, is referred to as an indifference map.
History
The theory of indifference curves was developed by Francis Ysidro Edgeworth, who explained in his 1881 book the mathematics needed for their drawing; later on, Vilfredo Pareto was the first author to actually draw these curves, in his 1906 book. The theory can be derived from William Stanley Jevons' ordinal utility theory, which posits that individuals can always rank any consumption bundles by order of preference.
Map and properties of indifference curves
A graph of indifference curves for several utility levels of an individual consumer is called an indifference map. Points yielding different utility levels are each associated with distinct indifference curves and these indifference curves on the indifference map are like contour lines on a topographical map. Each point on the curve represents the same elevation. If you move "off" an indifference curve traveling in a northeast direction (assuming positive marginal utility for the goods) you are essentially climbing a mound of utility. The higher you go the greater the level of utility. The non-satiation requirement means that you will never reach the "top," or a "bliss point," a consumption bundle that is preferred to all others.
Indifference curves are typically represented to be:
- Defined only in the non-negative quadrant of commodity quantities (i.e. the possibility of having negative quantities of any good is ignored).
- Negatively sloped. That is, as quantity consumed of one good (X) increases, total satisfaction would increase if not offset by a decrease in the quantity consumed of the other good (Y). Equivalently, satiation, such that more of either good (or both) is equally preferred to no increase, is excluded. (If utility U = f(x, y), U, in the third dimension, does not have a local maximum for any x and y values.) The negative slope of the indifference curve reflects the assumption of the monotonicity of consumer's preferences, which generates monotonically increasing utility functions, and the assumption of non-satiation (marginal utility for all goods is always positive); an upward sloping indifference curve would imply that a consumer is indifferent between a bundle A and another bundle B because they lie on the same indifference curve, even in the case in which the quantity of both goods in bundle B is higher. Because of monotonicity of preferences and non-satiation, a bundle with more of both goods must be preferred to one with less of both, thus the first bundle must yield a higher utility, and lie on a different indifference curve at a higher utility level. The negative slope of the indifference curve implies that the marginal rate of substitution is always positive;
- Complete, such that all points on an indifference curve are ranked equally preferred and ranked either more or less preferred than every other point not on the curve. So, with (2), no two curves can intersect (otherwise non-satiation would be violated).
- Transitive with respect to points on distinct indifference curves. That is, if each point on I2 is (strictly) preferred to each point on I1, and each point on I3 is preferred to each point on I2, each point on I3 is preferred to each point on I1. A negative slope and transitivity exclude indifference curves crossing, since straight lines from the origin on both sides of where they crossed would give opposite and intransitive preference rankings.
- (Strictly) convex. With (2), convex preferences imply that the indifference curves cannot be concave to the origin, i.e. they will either be straight lines or bulge toward the origin of the indifference curve. If the latter is the case, then as a consumer decreases consumption of one good in successive units, successively larger doses of the other good are required to keep satisfaction unchanged.