
 | ||
Illite crystallinity is a technique used to classify low-grade metamorphic activity in pelitic rocks. Determining the "illite crystallinity index" allows geologists to designate what metamorphic facies and metamorphic zone the rock was formed in and to infer what temperature the rock was formed. Several crystallinity indices have been proposed in recent years, but currently the Kübler index is being used due to its reproducibility and simplicity. The Kübler index is experimentally determined by measuring the full width at half maximum for the X-ray diffraction reflection peak along the (001) crystallographic axis of the rock sample. This value is an indirect measurement of the thickness of illite/muscovite packets which denote a change in metamorphic grade. The method can be used throughout the field of geology in areas such as the petroleum industry, plate tectonics.
Contents
Illite crystallinity progression
As stated above, the Kübler index was not always the preferred index for illite crystallinity studies in the past. Prior to the introduction of the Kübler index, there were several other indices used to classify low grade metamorphic rocks. Two of the more popular methods of the past are the Weaver index and the Weber index, introduced in 1960 and 1972 respectively. These studies consist of mainly the same types of methods but vary in their expression of ratio measurements. The Kübler index, introduced by Bernard Kübler in 1964 for petroleum exploration and improved on in later years, has come to be the go-to index for illite crystallinity based on its reproducibility and simplicity.
Applications
Illite crystallinity is useful when trying to determine what type of metamorphic conditions a rock was subjected to during its formation. Illite crystallinity can be used to trace the low grade metamorphic transition from zeolite facies to greenschist facies (diagenetic zone to epizone). This change is flagged by the change of thin illite grains to thicker illite/muscovite grains. This low grade metamorphic technique can also be put into use when there is an absence in change of mineral structure which applies to higher grade metamorphism. Early use of illite crystallinity was in the petroleum industry to determine the transition from a dry gas phase to an unproductive rock. Recently, this technique has expanded in the field and now is used in areas such as palaeotectonics and geodynamic reconstructions.
Rock preparation and methods
Rock sample preparation for illite crystallinity can vary slightly, but boils down to basically the same steps. Although for accurate returns in testing, consistency of sample preparation is a must. General sample preparation for illite crystallinity is as follows:
- Rinse and dry the field sample
- Crush the sample
- Stir sample into deionized water and let settle overnight to isolate clay sized particles (<2 μm)
- Dry supernatant containing <2 μm particles
- Mix with deionized water and centrifuge
- Collect supernatant containing <2 μm particles
- Centrifuge <2 μm particle solution and dry
- Mix with water and deposit on a glass slide
The sample is first broken down, using the steps above, and prepared for XRD analysis. Results from the XRD are then compared to pre-established values assigned to metamorphic zones/metamorphic facies. The targets of the results are the peaks on the XRD plots. Width of the illite XRD peak at one half of its height is collected and recorded with units of ∆ °2θ (XRD angle). Comparison and classification of metamorphic facies is then determined for the sample.
Interpreting results
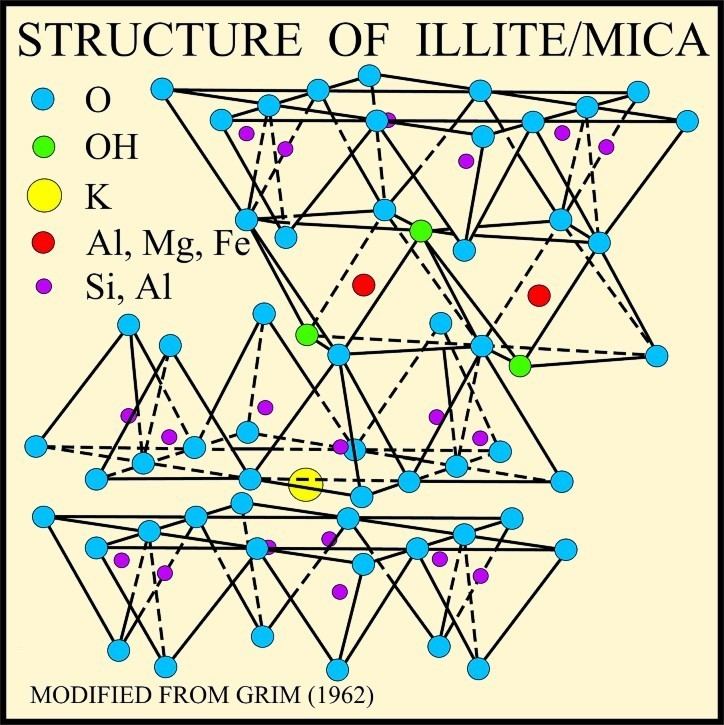
Illite (K0.65Al2.0[Al0.65Si3.35O10](OH)2) and muscovite (KAl2(AlSi3O10)(OH)2) are both phyllosilicates similar in structure and composition. Illite is made up of thin, 1 nm, layers which are made up of tetrahedral-octahedral-tetrahedral (TOT) sheets. Illite contains more silicon, iron and magnesium than muscovite, as well as less tetrahedral aluminium and interlayered potassium.
X-Ray diffraction plots provide information on angles and intensities of refracted beams which allow scientists to construct a 3D model of the crystalline structure. The focus of an illite crystallinity XRD plot is the main peak. Width of the peak at one half of its height is measured and this angle (recorded with units of ∆ °2θ), can be plotted on a chart with metamorphic zones and facies like the one in figure 2. If the illite crystallinity values fall in the 0-0.25 °2θ range, it corresponds with a metamorphic epizone or greenschist facies. If the illite crystallinity values fall in the 0.25-0.30 °2θ range, it corresponds with a metamorphic high anchizone or prehnite-pumpellyite facies. If the illite crystallinity values fall in the 0.30-0.42 °2θ range, it corresponds with a metamorphic low anchizone or prehnite-pumpellyite facies. If the illite crystallinity values fall in the 0.42-1.0 °2θ range, it corresponds with a metamorphic deep diagenetic zone or zeolite facies. If the illite crystallinity is > 1.0, it corresponds with a metamorphic shallow diagenetic zone or zeolite facies.
Generally, width of the diffraction peak can be related to c-axis parallel thickness of the illite crystallites. Thin packets produce broader peaks and thick packets return more narrow peaks. This is based on the destructive interference of the thick packets or the lack of interference in the thin packets, which cause this difference.