
 | ||
In physics and mathematics, the Ikeda map is a discrete-time dynamical system given by the complex map
Contents
The original map was proposed first by Ikeda as a model of light going around across a nonlinear optical resonator (ring cavity containing a nonlinear dielectric medium) in a more general form. It is reduced to the above simplified "normal" form by Ikeda, Daido and Akimoto
The original Ikeda map is often used in another modified form in order to take the saturation effect of nonlinear dielectric medium into account:
A 2D real example of the above form is:
where u is a parameter and
For
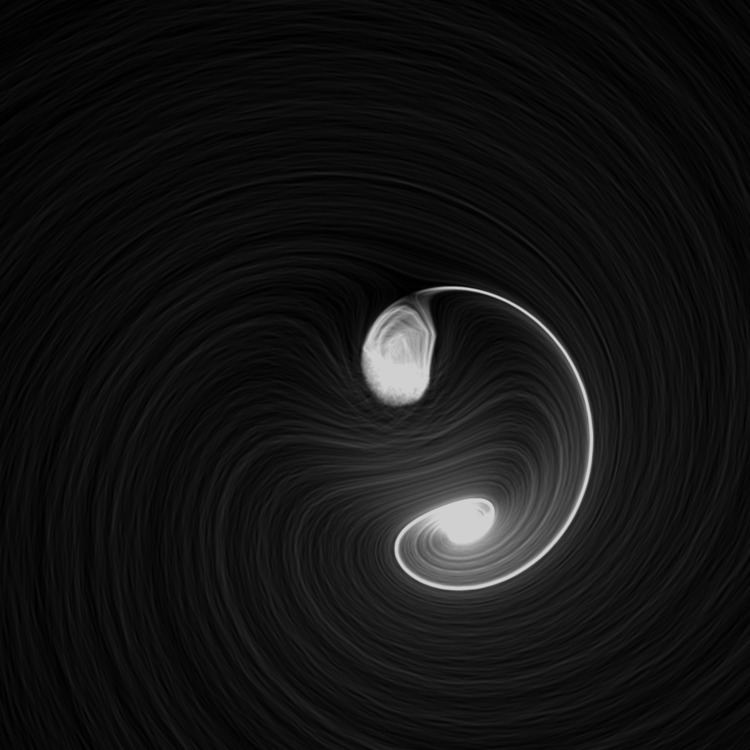
Attractor
This animation shows how the attractor of the system changes as the parameter
Point trajectories
The plots below show trajectories of 200 random points for various values of
Octave/MATLAB code for point trajectories
The Octave/MATLAB code to generate these plots is given below: