
Population 50 Civil parish Humberton Sovereign state United Kingdom | OS grid reference SE421686 Local time Thursday 4:02 PM District Borough of Harrogate | |
 | ||
Weather 12°C, Wind SW at 26 km/h, 68% Humidity | ||
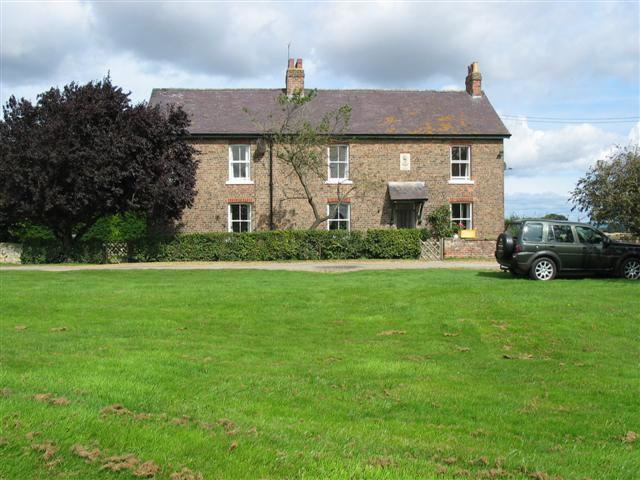
Humberton is a hamlet and civil parish in the Harrogate district of North Yorkshire, England. It is situated 2 miles (3.2 km) east from Boroughbridge and on the north side of the River Ure. The hamlet lies about one mile to the west of the Swale, and comprises 2,320 acres (9 km2) of land.
Contents
Map of Humberton, York, UK
The Ure, which separates the township from Aldborough, was crossed by a wooden bridge, at Milby, before the Conquest, and some remains of the bridge are still visible when the water is low. The name Humberton means 'Hund's fortified farm/settlement' or 'Hundr's fortified farm/settlement'. The population was estimated at 50 in 2013.
History
In the Domesday Book of 1086 Humberton was held by Gospatric. Part of Humberton was described as part of the soke of the king's manor of Aldborough, and until the 19th century Humberton was divided between the parishes of Kirby Hill and Aldborough. In 1866 Humberton became a separate civil parish.
Humberton was in the North Riding of Yorkshire until 1974, when it was transferred to the new county of North Yorkshire.
Since 1837 the parish has belonged to different Registration Districts: Ripon from 1837, Great Ouseburn from 1854, Thirsk from 1895, Northallerton from 1980 and North Yorkshire since 1998.
Population
The population has clearly aged over the last 150 years; the graph shows changes of the population of Humberton from 1801 to 2011. There was a high mortality decline just after 1850, which is indicated on the graph. This was mainly due to high infant mortality rates, this is the death of child before their first birthday. During the twentieth century a decrease of mortality rates and improved life expectancy in later life left significantly changed age structures. The population hit an all-time high 1850. There was another decline of population from 1900 to 1950, and since then has steadily increased.
Occupational structure
The first census was created in 1801 which only had 4 types of occupations listed. In 1841 over 3,00 different occupational titles were listed (a vast change from 1801) this created a very long and confusing table. By 1881 a more organised classification was used in the county, which covered 414 categories of occupation. The graph shows 4 main occupations that were popular in 1881; 'Agriculture','Domestic serive or offices', 'Professional', 'Animals' and 'Unknown'. Obviously agriculture would be the most active occupation due to the time period and land being fertile due to the river Ure. Unfortunately, because of the need to reorganise these statistics into different areas, for 1971 to 1991 the data collected covered over 10,000 wards, and only a very simple industrial classification is available for these, therefore some data is missing. Comparing this to the 2001 occupational history graph you can see that there was a change in popularity of occupations. Ellementory occupation became the most active population e.g. washing windows and other glass surfaces of buildings and delivering messages or goods. The change of interest of occupations could be led by a change in education as well as change of supply and demand of resources, information and goods.