
 | ||
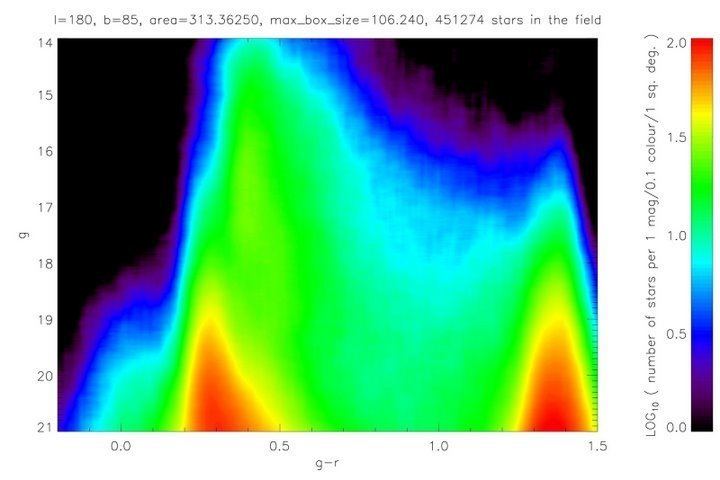
A Hess diagram plots the relative density of occurrence of stars at differing color–magnitude positions of the Hertzsprung–Russell diagram for a given galaxy. The diagram is named after R. Hess who originated it in 1924. Its use dates back to at least 1948.
References
Hess diagram Wikipedia(Text) CC BY-SA