Samiksha Jaiswal (Editor)

Hertfordshire County Council elections

Updated on
Edit
Like
Comment
Share on FacebookTweet on TwitterShare on LinkedInShare on Reddit
Hertfordshire County Council elections

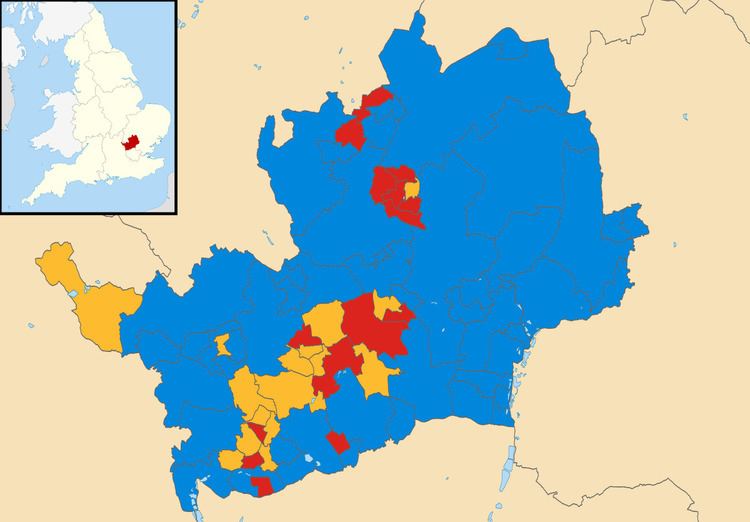
Hertfordshire County Council in England is elected every four years. Since the last boundary changes, that took effect for the 2001 election, 77 councillors are elected for single member districts.

Contents

Political control

Since 1973 political control of the council has been held by the following parties:

Council elections

  • Hertfordshire County Council election, 1993 - Labour 30, Conservative 27, Liberal Democrat 19, Independent 1
  • Hertfordshire County Council election, 1997 - Conservative 38, Labour 30, Liberal Democrat 9,
  • Hertfordshire County Council election, 2001 - Conservative 40, Labour 27, Liberal Democrat 10 (boundary changes took place for this election)
  • Hertfordshire County Council election, 2005 - Conservative 46, Labour 16, Liberal Democrat 14, Green 1
  • Hertfordshire Council election, 2009 - Conservative 55, Liberal Democrat 17, Labour 3, Green 1, BNP 1
  • Hertfordshire Council election, 2013 - Conservative 46, Liberal Democrat 16, Labour 15
  • By-election results

    By-elections are held for any vacancies that arise between elections.

    2009-2013

    At the preceding election there had also been candidates for the British National Party (307 votes, 8.0%) and for the Green Party (392 votes, 10.3%).

    Election caused by the resignation of previous incumbent.

    Election caused by the resignation of previous incumbent. Percentage change is since June 2009.

    2013-2017

    Caused by the death of the previous incumbent.

    References

    Hertfordshire County Council elections Wikipedia