
Elevation 512 m Population 306 (30 Sep 2009) | Canton Basel-Landschaft SFOS number 2827 Local time Friday 2:56 PM Postal code 4423 | |
 | ||
Website www.hersberg.ch SFSO statistics Weather 13°C, Wind NW at 6 km/h, 42% Humidity | ||
Hersberg is a municipality in the district of Liestal in the canton of Basel-Country in Switzerland.
Contents
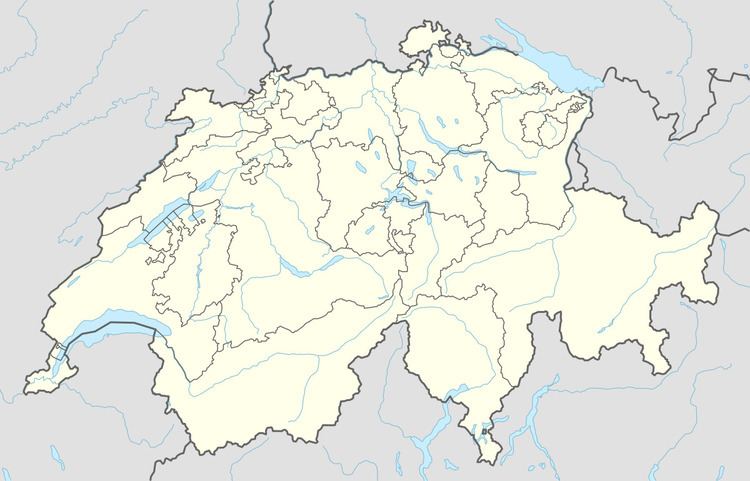
- Map of Hersberg Switzerland
- History
- Geography
- Coat of arms
- Demographics
- Politics
- Economy
- Religion
- Education
- References
Map of Hersberg, Switzerland
History
Hersberg is first mentioned in 1226 as Herisperch.
Geography
Hersberg has an area, as of 2009, of 1.67 square kilometers (0.64 sq mi). Of this area, 0.63 km2 (0.24 sq mi) or 37.7% is used for agricultural purposes, while 0.86 km2 (0.33 sq mi) or 51.5% is forested. Of the rest of the land, 0.2 km2 (0.077 sq mi) or 12.0% is settled (buildings or roads).
Of the built up area, housing and buildings made up 6.0% and transportation infrastructure made up 4.8%. Out of the forested land, all of the forested land area is covered with heavy forests. Of the agricultural land, 18.6% is used for growing crops and 14.4% is pastures, while 4.8% is used for orchards or vine crops.
The municipality is located in the Liestal district, along the drainage divide between the Ergolz, Violenbach and Talbächli rivers.
Coat of arms
The blazon of the municipal coat of arms is Argent, a House affronty Gules issuant from Coupeaux Vert, Chief chequy Argent and Gules.
Demographics
Hersberg has a population (as of March 2016) of 316. As of 2008, 7.2% of the population are resident foreign nationals. Over the last 10 years (1997–2007) the population has changed at a rate of 14%.
Most of the population (as of 2000) speaks German (255 or 97.7%), with English being second most common (2 or 0.8%) and English being third (2 or 0.8%). There is 1 person who speaksFrench and no one who speaks Romansh.
As of 2008, the gender distribution of the population was 50.3% male and 49.7% female. The population was made up of 273 Swiss citizens (89.8% of the population), and 31 non-Swiss residents (10.2%) Of the population in the municipality 68 or about 26.1% were born in Hersberg and lived there in 2000. There were 63 or 24.1% who were born in the same canton, while 99 or 37.9% were born somewhere else in Switzerland, and 25 or 9.6% were born outside of Switzerland.
In 2008 there was 1 live birth to Swiss citizens and 2 deaths of Swiss citizens. Ignoring immigration and emigration, the population of Swiss citizens decreased by 1 while the foreign population remained the same. There were 2 Swiss men and 2 Swiss women who immigrated back to Switzerland. At the same time, there was 1 non-Swiss man and 4 non-Swiss women who immigrated from another country to Switzerland. The total Swiss population change in 2008 (from all sources, including moves across municipal borders) was an increase of 9 and the non-Swiss population increased by 4 people. This represents a population growth rate of 4.4%.
The age distribution, as of 2010, in Hersberg is; 17 children or 5.6% of the population are between 0 and 6 years old and 33 teenagers or 10.9% are between 7 and 19. Of the adult population, 21 people or 6.9% of the population are between 20 and 29 years old. 38 people or 12.5% are between 30 and 39, 60 people or 19.7% are between 40 and 49, and 85 people or 28.0% are between 50 and 64. The senior population distribution is 38 people or 12.5% of the population are between 65 and 79 years old and there are 12 people or 3.9% who are over 80.
As of 2000, there were 89 people who were single and never married in the municipality. There were 145 married individuals, 9 widows or widowers and 18 individuals who are divorced.
As of 2000, there were 108 private households in the municipality, and an average of 2.4 persons per household. There were 24 households that consist of only one person and 5 households with five or more people. Out of a total of 109 households that answered this question, 22.0% were households made up of just one person and 1 were adults who lived with their parents. Of the rest of the households, there are 45 married couples without children, 33 married couples with children There were 5 single parents with a child or children.
In 2000 there were 71 single family homes (or 77.2% of the total) out of a total of 92 inhabited buildings. There were 8 multi-family buildings (8.7%), along with 12 multi-purpose buildings that were mostly used for housing (13.0%) and 1 other use buildings (commercial or industrial) that also had some housing (1.1%). Of the single family homes 3 were built before 1919, while 19 were built between 1990 and 2000. The greatest number of single family homes (26) were built between 1971 and 1980.
In 2000 there were 107 apartments in the municipality. The most common apartment size was 4 rooms of which there were 33. There was 1 single room apartments and 53 apartments with five or more rooms. Of these apartments, a total of 104 apartments (97.2% of the total) were permanently occupied, while 2 apartments (1.9%) were seasonally occupied and 1 apartments (0.9%) were empty. As of 2007, the construction rate of new housing units was 6.8 new units per 1000 residents. The vacancy rate for the municipality, in 2008, was 0%.
The historical population is given in the following chart:
Politics
In the 2007 federal election the most popular party was the SVP which received 36.83% of the vote. The next three most popular parties were the SP (21.33%), the Green Party (21.1%) and the FDP (10.25%). In the federal election, a total of 121 votes were cast, and the voter turnout was 50.6%.
Economy
As of 2007, Hersberg had an unemployment rate of 2.03%. As of 2005, there were 13 people employed in the primary economic sector and about 4 businesses involved in this sector. 5 people were employed in the secondary sector and there were 3 businesses in this sector. 15 people were employed in the tertiary sector, with 5 businesses in this sector. There were 161 residents of the municipality who were employed in some capacity, of which females made up 46.0% of the workforce.
In 2008 the total number of full-time equivalent jobs was 24. The number of jobs in the primary sector was 8, all of which were in agriculture. The number of jobs in the secondary sector was 6, of which 2 or (33.3%) were in manufacturing and 4 (66.7%) were in construction. The number of jobs in the tertiary sector was 10. In the tertiary sector; 2 or 20.0% were in wholesale or retail sales or the repair of motor vehicles, 3 or 30.0% were in a hotel or restaurant, 1 or 10.0% were in the information industry, 3 or 30.0% were technical professionals or scientists, .
In 2000, there were 136 workers who commuted away from the municipality. Of the working population, 12.4% used public transportation to get to work, and 66.5% used a private car.
Religion
From the 2000 census, 54 or 20.7% were Roman Catholic, while 147 or 56.3% belonged to the Swiss Reformed Church. Of the rest of the population, there was 1 individual who belongs to the Christian Catholic Church, and there were 5 individuals (or about 1.92% of the population) who belonged to another Christian church. There was 1 individual who was Jewish, and 3 (or about 1.15% of the population) who were Islamic. 45 (or about 17.24% of the population) belonged to no church, are agnostic or atheist, and 5 individuals (or about 1.92% of the population) did not answer the question.
Education
In Hersberg about 117 or (44.8%) of the population have completed non-mandatory upper secondary education, and 51 or (19.5%) have completed additional higher education (either university or a Fachhochschule). Of the 51 who completed tertiary schooling, 60.8% were Swiss men, 33.3% were Swiss women.
As of 2000, there were 29 students from Hersberg who attended schools outside the municipality.