
SFOS number 1132 Area 31.37 km² Population 1,799 (31 Dec 2008) | Postal code 6133 Elevation 650 m Local time Friday 7:42 AM | |
 | ||
Weather 5°C, Wind SE at 3 km/h, 97% Humidity | ||
Hergiswil bei Willisau is a municipality in the district of Willisau in the canton of Lucerne in Switzerland.
Contents
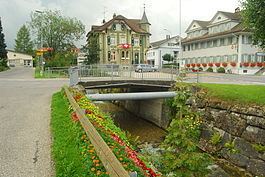
Map of Hergiswil bei Willisau, Switzerland
History
Hergiswil bei Willisau is first mentioned in 1246 as de Hergosswile.
Geography
Hergiswil bei Willisau has an area, as of 2006, of 31.3 km2 (12.1 sq mi). Of this area, 59.3% is used for agricultural purposes, while 36.6% is forested. Of the rest of the land, 3.5% is settled (buildings or roads) and the remainder (0.5%) is non-productive (rivers, glaciers or mountains). In the 1997 land survey, 36.66% of the total land area was forested. Of the agricultural land, 56.84% is used for farming or pastures, while 2.42% is used for orchards or vine crops. Of the settled areas, 1.72% is covered with buildings, 0.06% is industrial, 0.19% is classed as special developments, 0.1% is parks or greenbelts and 1.47% is transportation infrastructure. Of the unproductive areas, 0.19% is unproductive flowing water (rivers) and 0.35% is other unproductive land.
The municipality is located in the upper valley of the Enziwigger river in the northern Napfgebiet. It is a typical, for the alpine region, settlement of scattered farmhouses, alpine meadow grazing and forestry settlements.
Demographics
Hergiswil bei Willisau has a population (as of 31 December 2015) of 1,887. As of 2007, 54 or about 3.0% are not Swiss citizens. Over the last 10 years the population has decreased at a rate of -3.5%. Most of the population (as of 2000) speaks German (98.0%), with Albanian being second most common ( 0.8%) and Serbo-Croatian being third ( 0.3%).
In the 2007 election the most popular party was the CVP which received 54.7% of the vote. The next three most popular parties were the SVP (24%), the FDP (15.3%) and the SPS (2.6%).
The age distribution, as of 2008, in Hergiswil bei Willisau is; 499 people or 27.7% of the population is 0–19 years old. 470 people or 26.1% are 20–39 years old, and 547 people or 30.4% are 40–64 years old. The senior population distribution is 184 people or 10.2% are 65–79 years old, 84 or 4.7% are 80–89 years old and 15 people or 0.8% of the population are 90+ years old.
The entire Swiss population is generally well educated. In Hergiswil bei Willisau about 52.5% of the population (between age 25-64) have completed either non-mandatory upper secondary education or additional higher education (either university or a Fachhochschule).
As of 2000 there are 550 households, of which 102 households (or about 18.5%) contain only a single individual. 130 or about 23.6% are large households, with at least five members. As of 2000 there were 366 inhabited buildings in the municipality, of which 153 were built only as housing, and 213 were mixed use buildings. There were 108 single family homes, 25 double family homes, and 20 multi-family homes in the municipality. Most homes were either two (95) or three (40) story structures. There were only 11 single story buildings and 7 four or more story buildings.
Hergiswil bei Willisau has an unemployment rate of 0.56%. As of 2005, there were 467 people employed in the primary economic sector and about 173 businesses involved in this sector. 126 people are employed in the secondary sector and there are 21 businesses in this sector. 199 people are employed in the tertiary sector, with 29 businesses in this sector. As of 2000 49.3% of the population of the municipality were employed in some capacity. At the same time, females made up 38.3% of the workforce.
In the 2000 census the religious membership of Hergiswil bei Willisau was; 1,557 (86.1%) were Roman Catholic, and 136 (7.5%) were Protestant, with an additional 12 (0.66%) that were of some other Christian faith. There are 10 individuals (0.55% of the population) who are Muslim. Of the rest; there was 1 (0.06%) individual who belonged to another religion (not listed), 30 (1.66%) who do not belong to any organized religion, 63 (3.48%) who did not answer the question.
The historical population is given in the following table:
^a Population figures only for the village of Twing.