
 | ||
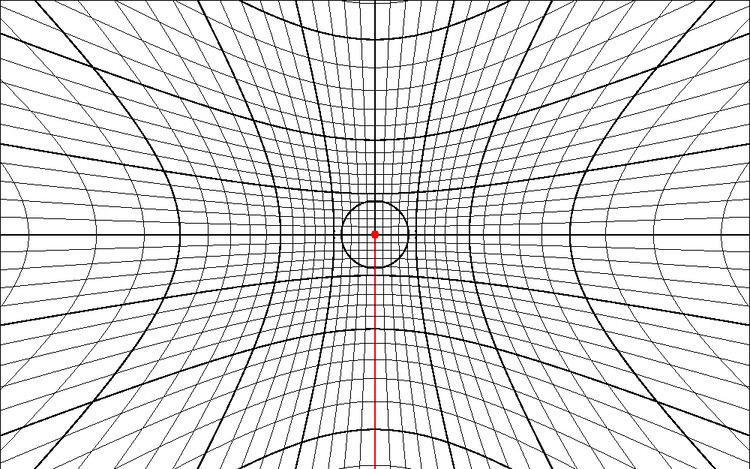
In crystallography, a Greninger chart /ˈɡrɛnɪŋər/ is a chart that allows angular relations between zones and planes in a crystal to be directly read from an x-ray diffraction photograph.
The Greninger chart is a simple trigonometric tool to determine g and d for a fixed sample-to-film distance. (If one uses a 2-d detector the problem of determining g and d could be solved mathematically using the equations which generate the Greninger chart) A new chart must be generated for different sample to detector distances. (2s is 2q for the diffraction peak and tan m is x/y for the Cartesian coordinates of the diffraction peak.) The Greninger chart gives directly the two angles needed to plot poles on the Wulff net. It is critical to keep track of the relative arrangement of the sample to the film, if photographic film is used then this is achieved by cutting the corner of the film. For Polaroid film one must make a note of the arrangement of the face of the film in the camera.