
 | ||
A Gran plot (also known as Gran titration or the Gran method) is a common means of standardizing a titrate or titrant by estimating the equivalence volume or end point in a strong acid-strong base titration or in a potentiometric titration. Such plots have been also used to calibrate glass electrodes, to estimate the carbonate content of aqueous solutions, and to estimate the Ka values (acid dissociation constants) of weak acids and bases from titration data.
Contents
- Basis of the calculations
- Titrating strong acid with strong base
- Titrating strong base with strong acid
- Concentrations and Dissociation Constants of Weak Acids
- Carbonate content
- Potentiometric monitoring of H
- Electrode calibration
- Potentiometric monitoring of other species
- Non ideal behaviour
- References
Gran plots use linear approximations of the a priori non-linear relationships between the measured quantity, pH or electromotive potential (emf), and the titrant volume. Other types of concentration measures, such as spectrophotometric absorbances or NMR chemical shifts, can in principle be similarly treated. These approximations are only valid near, but not at, the end point, and so the method differs from end point estimations by way of first- and second-derivative plots, which require data at the end point. Gran plots were originally devised for graphical determinations in pre-computer times, wherein an x-y plot on paper would be manually extrapolated to estimate the x-intercept. The graphing and visual estimation of the end point have been replaced by more accurate least-squares analyses since the advent of modern computers and enabling software packages, especially spreadsheet programs with built-in least-squares functionality.
Basis of the calculations
The Gran plot is based on the Nernst equation which can be written as
where E is a measured electrode potential, E0 is a standard electrode potential, s is the slope, ideally equal to RT/nF, and {H+} is the activity of the hydrogen ion. The expression rearranges to
depending on whether the electrode is calibrated in millivolts or pH. For convenience the concentration, [H+], is used in place of activity. In a titration of strong acid with strong alkali, the analytical concentration of the hydrogen ion is obtained from the initial concentration of acid, Ci and the amount of alkali added during titration.
where vi is the initial volume of solution, cOH is the concentration of alkali in the burette and v is the titre volume. Equating the two expressions for [H+] and simplifying, the following expression is obtained
A plot of
Titrating strong acid with strong base
For a strong acid-strong base titration monitored by pH, we have at any i'th point in the titration
where Kw is the water autoprotolysis constant.
If titrating an acid of initial volume
At the equivalence point, the equivalence volume
Thus,
The equivalence volume is used to compute whichever of
The pH meter is usually calibrated with buffer solutions at known pH values before starting the titration. The ionic strength can be kept constant by judicious choice of acid and base. For instance, HCl titrated with NaOH of approximately the same concentration will replace H+ with an ion (Na+) of the same charge at the same concentration, to keep the ionic strength fairly constant. Otherwise, a relatively high concentration of background electrolyte can be used, or the activity quotient can be computed.
Titrating strong base with strong acid
Mirror-image plots are obtained if titrating the base with the acid, and the signs of the slopes are reversed.
Hence,
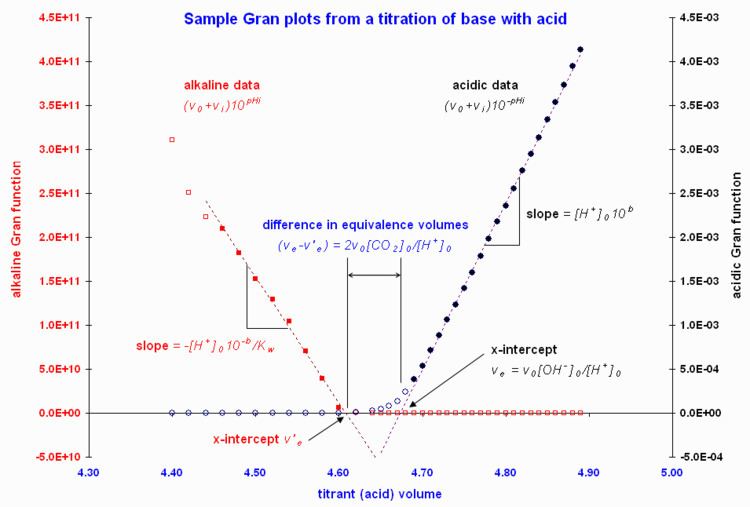
Figure 1 gives sample Gran plots of a strong base-strong acid titration.
Concentrations and Dissociation Constants of Weak Acids
The method can be used to estimate the dissociation constants of weak acids, as well as their concentrations (Gran, 1952). With an acid represented by HA, where
we have at any i'th point in the titration of a volume
are valid approximations, whence
A plot of
Similar equations can be written for the titration of a weak base by strong acid (Gran, 1952; Harris, 1998).
Carbonate content
Martell and Motekaitis (1992) use the most linear regions and exploit the difference in equivalence volumes between acid-side and base-side plots during an acid-base titration to estimate the adventitious CO2 content in the base solution. This is illustrated in the sample Gran plots of Figure 1. In that situation, the extra acid used to neutralize the carbonate, by double protonation, in volume
When the total CO2 content is significant, as in natural waters and alkaline effluents, two or three inflections can be seen in the pH-volume curves owing to buffering by higher concentrations of bicarbonate and carbonate. As discussed by Stumm and Morgan (1981), the analysis of such waters can use up to six Gran plots from a single titration to estimate the multiple end points and measure the total alkalinity and the carbonate and/or bicarbonate contents.
Potentiometric monitoring of H+
To use potentiometric (e.m.f.) measurements
Thus, as before for a titration of strong acid by strong base,
Analogous plots can be drawn using data from a titration of base by acid.
Electrode calibration
Note that the above analysis requires prior knowledge of
If a pH electrode is not well calibrated, an offset correction can be computed in situ from the acid-side Gran slope:
In the sample data illustrated in Figure 1, this offset correction was not insignificant, at -0.054 pH units.
The value of
Based on earlier work by McBryde (1969), Gans and O'Sullivan (2000) describe an iterative approach to arrive at both
The procedure could in principle be modified for titrations of base by acid. A computer program named GLEE (for GLass Electrode Evaluation) implements this approach on titrations of acid by base for electrode calibration. This program additionally can compute (by a separate, non-linear least-squares process) a 'correction' for the base concentration. An advantage of this method of electrode calibration is that it can be performed in the same medium of constant ionic strength which may later be used for the determination of equilibrium constants.
Note that the regular Gran functions will provide the required equivalence volumes and, as
Potentiometric monitoring of other species
Potentiometric data are also used to monitor species other than
To illustrate, consider a titration of Cl− by Ag+ monitored potentiometrically:
Hence,
Figure 3 gives sample plots of potentiometric titration data.
Non-ideal behaviour
In any titration lacking buffering components, both before-equivalence and beyond-equivalence plots should ideally cross the x axis at the same point. Non-ideal behaviour can result from measurement errors (e.g. a poorly calibrated electrode, an insufficient equilibration time before recording the electrode reading, drifts in ionic strength), sampling errors (e.g. low data densities in the linear regions) or an incomplete chemical model (e.g. the presence of titratable impurities such as carbonate in the base, or incomplete precipitation in potentiometric titrations of dilute solutions, for which Gran et al. (1981) propose alternate approaches). Buffle et al. (1972) discuss a number of error sources.
Because the