
 | ||
The study of geometric morphometrics in anthropology has made a major impact on the field of morphometrics by aiding in some of the technological and methodological advancements. Geometric morphometrics is an approach that studies shape using Cartesian landmark and semilandmark coordinates that are capable of capturing morphologically distinct shape variables. The landmarks can be analyzed using various statistical techniques separate from size, position, and orientation so that the only variables being observed are based on morphology. Geometric morphometrics is used to observe variation in numerous formats, especially those pertaining to evolutionary and biological processes, which can be used to help explore the answers to a lot of questions in physical anthropology. Geometric morphometrics is part of a larger subfield in anthropology, which has more recently been named virtual anthropology. Virtual anthropology looks at virtual morphology, the use of virtual copies of specimens to perform various quantitative analyses on shape (such as geometric morphometrics) and form...
Contents
- Background
- Traditional morphometrics
- Steps in a geometric morphometric study
- Landmarks
- Semilandmarks
- Deformation grid
- Generalized Procrustes analysis GPA
- Principal components analysis PCA
- Partial least squares PLS
- Multivariate regression
- The human brain
- Pleistocene cranial morphology
- Ancestry and sex estimation of crania
- Sex estimation of os coxae
- Standard books
- Equipment
- Useful links
- References
Background
The field of geometric morphometrics grew out of the accumulation of improvements of methods and approaches over several decades beginning with Francis Galton (1822-1911). Galton was a polymath and the president of the Anthropological Institute of Great Britain. In 1907 he invented a way to quantify facial shapes using a base-line registration approach for shape comparisons. This was later adapted by Fred Bookstein and termed “two-point coordinates” or “Bookstein-shape coordinates”.
In the 1940s, D’Arcy Wentworth Thompson (biologist and mathematician, 1860-1948) looked at ways to quantify that could be attached to biological shape based on developmental and evolutionary theories. This led to the first branch of multivariate morphometrics, which emphasized matrix manipulations involving variables. In the late 1970s and early 1980s, Fred Bookstein (currently a professor of Anthropology at the University of Vienna) began using Cartesian transformations and David George Kendall (statistician, 1918-2007) showed that figures that hold the same shape can be treated as separate points in a geometric space. Finally, in 1996, Leslie Marcus (paleontologist, 1930-2002) convinced colleagues to use morphometrics on the famous Ötzi skeleton, which helped expose the importance of the applications of these methods.
Traditional morphometrics
Traditional morphometrics is the study of morphological variations between or within groups using multivariate statistical tools. Shape is defined by collecting and analyzing length measurements, counts, ratios, and angles. The statistical tools are able to quantify the covariation within and between samples. Some of the typical statistical tools used for traditional morphometrics are: principal components, factor analysis, canonical variate, and discriminant function analysis. It is also possible to study allometry, which is the observed change in shape when there is change in size. However, there are problems pertaining to size correction since linear distance is highly correlated with size. There have been multiple methods put forth to correct for this correlation, but these methods disagree and can end up with different results using the same dataset. Another problem is linear distances are not always defined by the same landmarks making it difficult to use for comparative purposes. For shape analysis itself, which is the goal of morphometrics, the biggest downside to traditional morphometrics is that it does not capture the complete variation of shape in space, which is what the measurements are supposed to based on. For example, if one tried to compare the length and width for an oval and tear drop shape with the same dimensions they would be deemed as the same using traditional morphometrics. Geometric morphometrics attempts to correct these problematic areas by more fully capturing shape variability.
Steps in a geometric morphometric study
There is a basic structure to successfully performing and completing every geometric morphometric study:
- Design Study: what is your objective/hypothesis? what morphology must you capture to explore this?
- Collect Data: choose your landmark set and method of collection
- Standardize Data: make your landmarks comparable across all specimens (superimposition)
- Analyze Data: choose a statistical approach depending on your original question and how you designed the study
- Interpret Results: take the outcome of your statistical analysis and reflect it back to the context of your original specimens
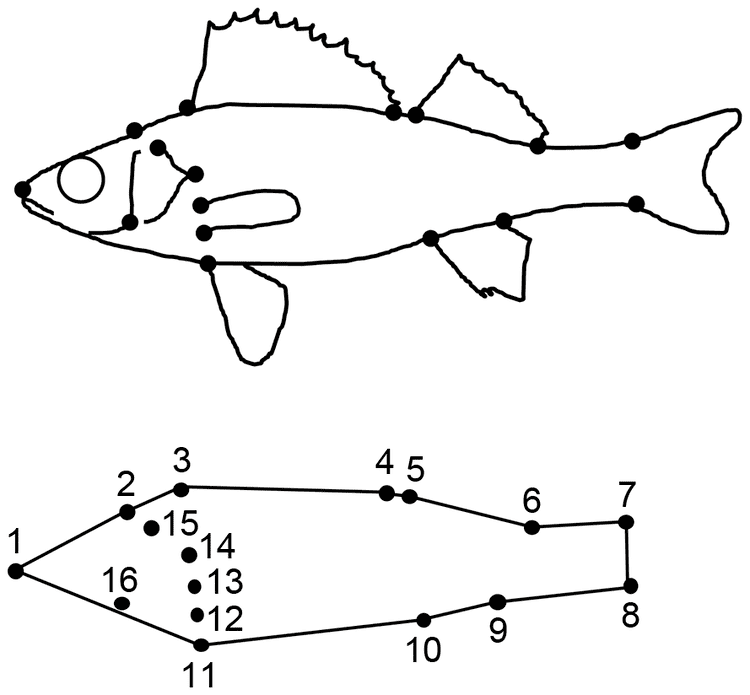
Landmarks
The first step is to define your landmark set. Landmarks have to be anatomically recognizable and the same for all specimens in the study. Landmarks should be selected to properly capture the shape trying to be observed and capable of being replicated. The sample size should be roughly three times the amount of landmarks chosen and they must be recorded in the same order for every specimen.
Semilandmarks
Semilandmarks, also called sliding landmarks, are used when the location of a landmark along a curvature might not be identifiable or repeatable. Semilandmarks were created in order to take landmark based geometric morphometrics to the next step by capturing the shape of difficult areas such as smooth curves and surfaces. In order to obtain a semilandmark, the curvature still has to start and end on definable landmarks, capture observed morphology, remain homologous across specimens in the same steps seen above for regular landmarks, be equal in number, and equally distant apart. When this approach was first proposed, Bookstein suggested gaining semilandmarks by densely sampling landmarks along the surface in a mesh and slowly thinning out the landmarks until the desired curvature was obtained. Newer landmark programs aid in the process but there are still some steps that must be taken in order for the semilandmarks to be the same across the whole sample. Semilandmarks are not placed on the actual curve or surface but on tangent vectors to the curve or tangent planes to the surface. The sliding of semilandmarks in new programs is performed by either selecting a specimen to be the model specimen for the rest of the specimens or using a computational sample mean from tangent vectors. Semilandmarks are automatically placed in most programs when the observer chooses a starting and ending point on definable landmarks and sliding the semilandmarks between them until the shape is captured. The semilandmarks are then mapped onto the rest of the specimens in the sample. Since shape will differ between specimens, the observer has to manually go through and make sure the landmarks and semilandmarks are on the surface for the rest of the specimens. If not they must be moved to touch the surface, but this process still maintains the correct location. There is still room for improvement to these methods but this is the most consistent option at the moment. Once mapped on, these semilandmarks can be treated just like landmarks for statistical analysis.
Deformation grid
This is a different approach to data collection than using landmarks and semilandmarks. In this approach, deformation grids are used to capture the morphological shape differences and changes. The general idea is that shape variations can be recorded from one specimen to another based on the distortion of a grid. Bookstein proposed the use of a thin-plate spline (TPS) interpolation, which is a computed deformation grid that calculates a mapping function between two individuals that measures point differences. Basically, the TPS interpolation has a template computed grid that is applied to specimens and the differences in shape can be read from the different deformations of the template. The TPS can be used for both two- and three-dimensional data, but has proved less effective for visualizing three-dimensional differences, but it can easily be applied to the pixels of an image or volumetric data from CT or MRI scans.
Generalized Procrustes analysis (GPA)
Landmark and semilandmark coordinates can be recorded on each specimen, but size, orientation, and position can vary for each of those specimens adding in variables that distract from the analysis of shape. This can be fixed by using superimposition, with generalized procrusted analysis (GPA) being the most common application. GPA removes the variation of size, orientation, and position by superimposing the landmarks in a common coordinate system. The landmarks for all specimens are optimally translated, rotated, and scaled based on a least-squared estimation. The first step is translation and rotation to minimize the squared and summed differences (squared Procrustes distance) between landmarks on each specimen. Then the landmarks are individually scaled to the same unit Centroid size. Centroid size is the square root of the sum of squared distances of the landmarks in configuration to their mean location. The translation, rotation, and scaling bring the landmark configurations for all specimens into a common coordinate system so that the only differing variables are based on shape alone. The new superimposed landmarks can now be analyzed in multivariate statistical analyses.
Principal components analysis (PCA)
In general, principal components analysis is used to construct overarching variables that take the place of multiple correlated variables in order to reveal the underlying structure of the dataset. This is helpful in geometric morphometrics where a large set of landmarks can create correlated relationships that might be difficult to differentiate without reducing them in order to look at the overall variability in the data. Reducing the number of variables is also necessary because the number of variables being observed and analyzed should not exceed sample size. Principal component scores are computed through an eigendecomposition of a sample’s covariance matrix and rotates the data to preserve procrustes distances. In other words, a principal components analysis preserves the shape variables that were scaled, rotated, and translated during the generalize procrustes analysis. The resulting principal component scores project the shape variables onto low-dimensional space based on eigenvectors. The scores can be plotted various ways to look at the shape variables, such as scatterplots. It is important to explore what shape variables are being observed to make sure the principal components being analyzed are pertinent to the questions being asked. Although the components might show shape variables not relevant to the question at hand, it is perfectly acceptable to leave those components out any further analysis for a specific project.
Partial least squares (PLS)
Partial least squares is similar the principal components analysis in the fact that it reduces the number of variables being observed so patterns are more easily observed in the data, but it uses a linear regression model. PLS is an approach that looks at two or more sets of variables measured on the same specimens and extracts the linear combinations that best represent the pattern of covariance across the sets. The linear combinations will optimally describe the covariances and provide a low-dimensional output to compare the different sets. With the highest shape variation covariance, mean shape, and the other shape covariances that exists among the sets, this approach is ideal for looking at the significance of group differences. PLS has been used a lot in studies that look at things such as sexual dimorphism, or other general morphological differences found at the population, subspecies, and species level. It has also been used to look at functional, environmental, or behavioral differences that could influence the found shape covariance between sets
Multivariate regression
Multiple or multivariate regression is an approach to look at the relationship between several independent or predictor variables and a dependent or influential variable. It is best used in geometric morphometrics when analyzing shape variables based on an external influence. For example, it can be used in studies with attached functional or environmental variables like age or the development over time in certain environments. The multivariate regression of shape based on the logarithm of centroid size (square root of the sum of squared distances of landmarks) is ideal for allometric studies. Allometry is the analysis of shape based on the biological parameters of growth and size. This approach is not affected by the number of dependent shape variables or their covariance, so the results of regression coefficients can be seen as a deformation in shape.
The human brain
The human brain is unique from other species based on the size of the visual cortex, temporal lobe, and parietal cortex, and increased gyrification (folds of the brain). There have been many questions as to why these changes occurred and how they contributed to cognition and behavior, which are important questions in human evolution. Geometric morphometrics has been used to explore some of these questions using virtual endocasts (casts of the inside of the cranium) to gather information since brain tissue does not preserve in the fossil record. Geometric morphometrics can reveal small shape differences between brains such as differences between modern humans and Neanderthals whose brains were similar in size. Neubauer and colleagues looked at the endocasts of chimpanzees and modern humans to observe brain growth using 3D landmarks and semilandmarks. They found that there is an early “globularization phase” in human brain development that shows expansion of the parietal and cerebellar areas, which does not occur in chimpanzees. Gunz and colleagues extended the study further and found that the “globularization phase” does not occur in Neanderthals and instead Neanderthal brain growth is more similar to chimpanzees. This difference could point to some important changes in the human brain that led to different organization and cognitive functions
Pleistocene cranial morphology
There have been many debates on the relationships between Middle Pleistocene hominin crania from Eurasia and Africa because they display a mosaic of both primitive and derived traits. Studies on cranial morphology for these specimens have created arguments that Eurasian fossils from the Middle Pleistocene are a transition between Homo erectus and later hominins like Neanderthals and modern humans. However, there are two sides to the argument with one side saying that the European and African fossils are from a single taxon while others say that the Neanderthal lineage should be included. Harvati and colleagues decided to attempt to quantify the craniofacial features of Neanderthals and European Middle Pleistocene fossils using 3D landmarks to try to add to the debate. They found that some features were more Neanderthal like while others were primitive and likely from the Middle Pleistocene African hominins, so the argument could still go either way. Freidline and colleagues further added to the debate by looking at both adult and subadult crania of modern and Pleistocene hominins using 3D landmarks and semilandmarks. They found similarities in facial morphology between Middle Pleistocene fossils from Europe and Africa and a divide in facial morphology during the Pleistocene based on time period. The study also found that some characteristics separating Neanderthals from Middle Pleistocene hominins, like the size of the nasal aperture and degree of midfacial prognathism, might be due to allometric differences
Ancestry and sex estimation of crania
Crania can be used to classify ancestry and sex to aid in forensic contexts such as crime scenes and mass fatalities. In 2010, Ross and colleagues were provided federal funds by the U.S. Department of Justice to compile data for population specific classification criteria using geometric morphometrics. Their aim was to create an extensive population database from 3D landmarks on human crania, to develop and validate population specific procedures for classification of unknown individuals, and develop software to use in forensic identification. They placed 3D landmarks on 75 craniofacial landmarks from European, African, and Hispanic populations of about 1000 individuals with a Microscribe digitizer. The software they developed, called 3D-ID, can classify unknown individuals into probable sex and ancestry, and allows for fragmentary and damaged specimens to be used. A copy of the full manuscript can be found here: Geometric Morphometric Tools for the Classification of Human Skulls
Sex estimation of os coxae
Geometric morphometrics can also be used to capture the slight shape variations found in postcranial bones of the human body such as os coxae. Bierry and colleagues used 3D CT reconstructions of modern adult pelvic bones for 104 individuals to look at the shape of the obturator foramen. After a normalization technique to take out the factor of size, they outlined the obturator foramen with landmarks and semilandmarks to capture its shape. They chose the obturator foramen because it tends to be oval in females and triangular in males. The results show a classification accuracy of 88.5% for males and 80.8% for females using a Discriminant Fourier Analysis. Another study done by Gonzalez and colleagues used geometric morphometrics to capture the complete shape of the ilium and ischiopubic ramus. They placed landmarks and semilandmarks on 2D photographic images of 121 left pelvic bones from a collection of undocumented skeletons at the Museu Anthropológico de Coimbra in Portugal. Since the pelvic bones were of unknown origin, they used a K-means Cluster Analysis to determine a sex category before performing a Discriminant Function analysis. The results had a classification accuracy for the greater sciatic notch of 90.9% and the ischiopubic ramus at 93.4 to 90.1%
Standard books
The books listed below are the standard suggestions for anyone who wants to obtain a comprehensive understanding of morphometrics (referred to by colors):
-The Red Book: Bookstein, F. L., B. Chernoff, R. Elder, J. Humphries, G. Smith, and R. Strauss. 1985. Morphometrics in Evolutionary Biology
-The Blue Book: Rohlf, F. J. and F. L. Bookstein (eds.). 1990. Proceedings of the Michigan Morphometrics Workshop
-The Orange Book: Bookstein, F. L. 1991. Morphometric Tools for Landmark Data. Geometry and Biology
-The Black Book: Marcus, L. F., E. Bello, A. García-Valdecasas (eds.). 1993. Contributions to Morphometrics
-The Green Book: Zelditch, M. L., D. L. Swiderski, H. D. Sheets, and W. L. Fink. 2004. Geometric Morphometrics for biologists: A Primer
Equipment
2D Equipment
3D Equipment