Supriya Ghosh (Editor)

Geometric Brownian motion

Updated on
Edit
Like
Comment
Share on FacebookTweet on TwitterShare on LinkedInShare on Reddit
Geometric Brownian motion

A geometric Brownian motion (GBM) (also known as exponential Brownian motion) is a continuous-time stochastic process in which the logarithm of the randomly varying quantity follows a Brownian motion (also called a Wiener process) with drift. It is an important example of stochastic processes satisfying a stochastic differential equation (SDE); in particular, it is used in mathematical finance to model stock prices in the Black–Scholes model.

Contents

Technical definition: the SDE

A stochastic process St is said to follow a GBM if it satisfies the following stochastic differential equation (SDE):

d S t = μ S t d t + σ S t d W t

where W t is a Wiener process or Brownian motion, and μ ('the percentage drift') and σ ('the percentage volatility') are constants.

The former is used to model deterministic trends, while the latter term is often used to model a set of unpredictable events occurring during this motion.

Solving the SDE

For an arbitrary initial value S0 the above SDE has the analytic solution (under Itō's interpretation):

S t = S 0 exp ( ( μ σ 2 2 ) t + σ W t ) .

To arrive at this formula, we will divide the SDE by S t in order to have our choice random variable be on only one side. From there we write the previous equation in Itō integral form:

0 t d S t S t = μ t + σ W t , assuming  W 0 = 0 .

Of course, d S t S t looks related to the derivative of ln S t . However, S t is an Itō process which requires the use of Itō calculus. Applying Itō's formula leads to

d ( ln S t ) = d S t S t 1 2 1 S t 2 d S t d S t

Where d S t d S t is the quadratic variation of the SDE. This can also be written as d [ S ] t or S . t . . In this case we have:

d S t d S t = σ 2 S t 2 d t .

Plugging the value of d S t in the above equation and simplifying we obtain

ln S t S 0 = ( μ σ 2 2 ) t + σ W t .

Taking the exponential and multiplying both sides by S 0 gives the solution claimed above.

Properties

The above solution S t (for any value of t) is a log-normally distributed random variable with expected value and variance given by

E ( S t ) = S 0 e μ t , Var ( S t ) = S 0 2 e 2 μ t ( e σ 2 t 1 ) ,

that is the probability density function of a St is:

f S t ( s ; μ , σ , t ) = 1 2 π 1 s σ t exp ( ( ln s ln S 0 ( μ 1 2 σ 2 ) t ) 2 2 σ 2 t ) .

When deriving further properties of GBM, use can be made of the SDE of which GBM is the solution, or the explicit solution given above can be used. For example, consider the stochastic process log(St). This is an interesting process, because in the Black–Scholes model it is related to the log return of the stock price. Using Itō's lemma with f(S) = log(S) gives

d log ( S ) = f ( S ) d S + 1 2 f ( S ) S 2 σ 2 d t = 1 S ( σ S d W t + μ S d t ) 1 2 σ 2 d t = σ d W t + ( μ σ 2 / 2 ) d t .

It follows that E log ( S t ) = log ( S 0 ) + ( μ σ 2 / 2 ) t .

This result can also be derived by applying the logarithm to the explicit solution of GBM:

log ( S t ) = log ( S 0 exp ( ( μ σ 2 2 ) t + σ W t ) ) = log ( S 0 ) + ( μ σ 2 2 ) t + σ W t .

Taking the expectation yields the same result as above: E log ( S t ) = log ( S 0 ) + ( μ σ 2 / 2 ) t .

Multivariate version

GBM can be extended to the case where there are multiple correlated price paths.

Each price path follows the underlying process

d S t i = μ i S t i d t + σ i S t i d W t i ,

where the Wiener processes are correlated such that E ( d W t i d W t j ) = ρ i , j d t where ρ i , i = 1 .

For the multivariate case, this implies that

C o v ( S t i , S t j ) = S 0 i S 0 j e ( μ i + μ j ) t ( e ρ i , j σ i σ j t 1 ) .

Use in finance

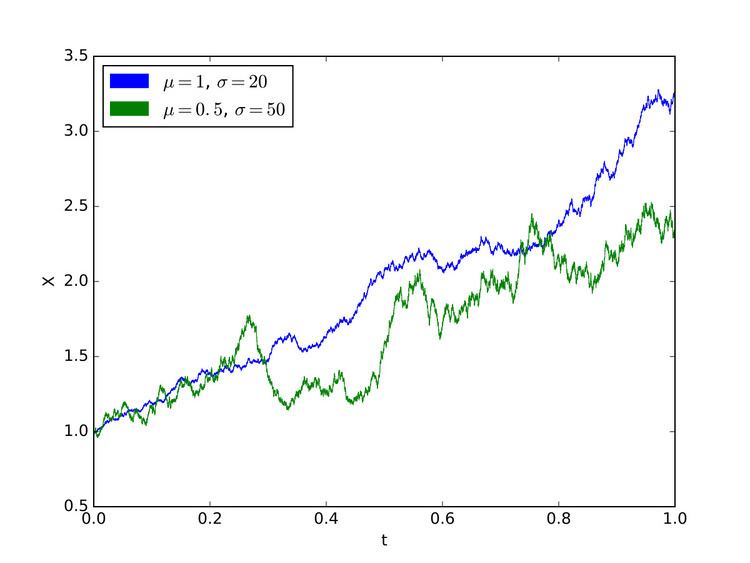
Geometric Brownian motion is used to model stock prices in the Black–Scholes model and is the most widely used model of stock price behavior.

Some of the arguments for using GBM to model stock prices are:

  • The expected returns of GBM are independent of the value of the process (stock price), which agrees with what we would expect in reality.
  • A GBM process only assumes positive values, just like real stock prices.
  • A GBM process shows the same kind of 'roughness' in its paths as we see in real stock prices.
  • Calculations with GBM processes are relatively easy.
  • However, GBM is not a completely realistic model, in particular it falls short of reality in the following points:

  • In real stock prices, volatility changes over time (possibly stochastically), but in GBM, volatility is assumed constant.
  • In real life, stock prices often show jumps caused by unpredictable events or news, but in GBM, the path is continuous (no discontinuity).
  • Extensions

    In an attempt to make GBM more realistic as a model for stock prices, one can drop the assumption that the volatility ( σ ) is constant. If we assume that the volatility is a deterministic function of the stock price and time, this is called a local volatility model. If instead we assume that the volatility has a randomness of its own—often described by a different equation driven by a different Brownian Motion—the model is called a stochastic volatility model.

    References

    Geometric Brownian motion Wikipedia