
 | ||
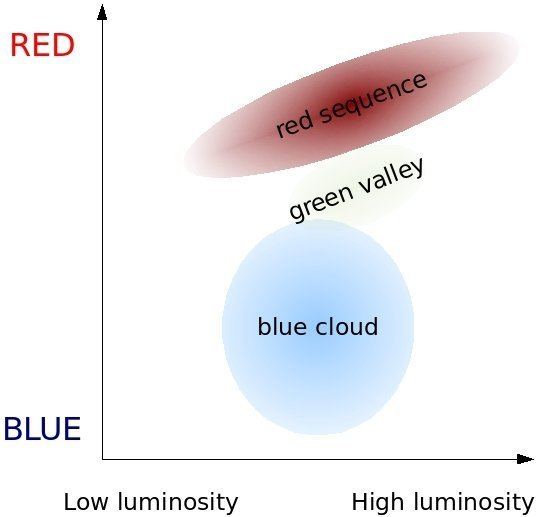
The galaxy color–magnitude diagram shows the relationship between absolute magnitude (a measure of luminosity) and mass of galaxies. A preliminary description of the three areas of this diagram was made in 2003 by Eric F. Bell et al. from the COMBO-17 survey that clarified the bimodal distribution of red and blue galaxies as seen in analysis of Sloan Digital Sky Survey data and even in de Vaucouleurs' 1961 analyses of galaxy morphology. Noticed in this diagram are three main features: the red sequence, the green valley, and the blue cloud. The red sequence includes most red galaxies which are generally elliptical galaxies. The blue cloud includes most blue galaxies which are generally spirals. In between the two distributions is an underpopulated space known as the green valley which includes a number of red spirals. Unlike the comparable Hertzsprung–Russell diagram for stars, galaxy properties are not necessarily completely determined by their location on the color–magnitude diagram. The diagram also shows considerable evolution through time. The red sequence earlier in evolution of the universe was more constant in color across magnitudes and the blue cloud was not as uniformly distributed but showed sequence progression.
New research suggests the green valley is actually composed of two different populations of galaxies: one of late-type galaxies, where star formation has been quenched due to their gas supplies being shut off followed by exhaustion of their gas reservoirs for several billion years, and another of early-type galaxies where both the gas supplies and gas reservoirs have been destroyed very quickly, likely because of mergers with other galaxies and/or the presence of an active galactic nucleus.
The Milky Way and the Andromeda Galaxy are assumed to lie in the green valley because their star formation is slowing down due to running out of gas.