Operating system | Written in C | |
 | ||
Initial release 1986; 31 years ago (1986) Stable release 7.12 / October 7, 2016; 4 months ago (2016-10-07) Repository sourceware.org/git/gitweb.cgi?p=binutils-gdb.git | ||
The GNU Debugger (GDB) is a portable debugger that runs on many Unix-like systems and works for many programming languages, including Ada, C, C++, Objective-C, Free Pascal, Fortran, Java and partially others.
Contents
History
GDB was first written by Richard Stallman in 1986 as part of his GNU system, after his GNU Emacs was "reasonably stable". GDB is free software released under the GNU General Public License (GPL). It was modeled after the DBX debugger, which came with Berkeley Unix distributions.
From 1990 to 1993 it was maintained by John Gilmore. Now it is maintained by the GDB Steering Committee which is appointed by the Free Software Foundation.
Features
GDB offers extensive facilities for tracing and altering the execution of computer programs. The user can monitor and modify the values of programs' internal variables, and even call functions independently of the program's normal behavior.
GDB target processors (as of 2003) include: Alpha, ARM, AVR, H8/300, Altera Nios/Nios II, System/370, System 390, X86 and its 64-bit extension X86-64, IA-64 "Itanium", Motorola 68000, MIPS, PA-RISC, PowerPC, SuperH, SPARC, and VAX. Lesser-known target processors supported in the standard release have included A29K, ARC, ETRAX CRIS, D10V, D30V, FR-30, FR-V, Intel i960, 68HC11, Motorola 88000, MCORE, MN10200, MN10300, NS32K, Stormy16, and Z8000. (Newer releases will likely not support some of these.) GDB has compiled-in simulators for even lesser-known target processors such like M32R or V850.
GDB is still actively developed. As of version 7.0 new features include support for Python scripting and as of version 7.8 GNU Guile scripting as well. Since version 7.0, support for "reversible debugging" — allowing a debugging session to step backward, much like rewinding a crashed program to see what happened — is available.
Remote debugging
GDB offers a 'remote' mode often used when debugging embedded systems. Remote operation is when GDB runs on one machine and the program being debugged runs on another. GDB can communicate to the remote 'stub' which understands GDB protocol via Serial or TCP/IP. A stub program can be created by linking to the appropriate stub files provided with GDB, which implement the target side of the communication protocol. Alternatively, gdbserver can be used to remotely debug the program without needing to change it in any way.
The same mode is also used by KGDB for debugging a running Linux kernel on the source level with gdb. With KGDB, kernel developers can debug a kernel in much the same way as they debug application programs. It makes it possible to place breakpoints in kernel code, step through the code and observe variables. On architectures where hardware debugging registers are available, watchpoints can be set which trigger breakpoints when specified memory addresses are executed or accessed. KGDB requires an additional machine which is connected to the machine to be debugged using a serial cable or Ethernet. On FreeBSD, it is also possible to debug using Firewire direct memory access (DMA).
Graphical user interface
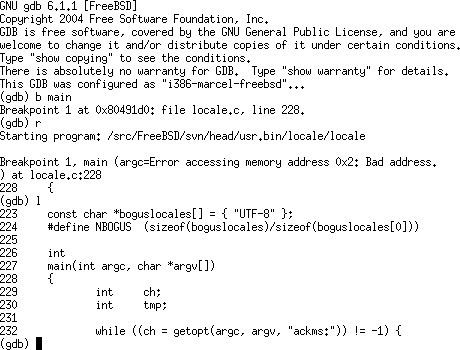
The debugger does not contain its own graphical user interface, and defaults to a command-line interface. Several front-ends have been built for it, such as UltraGDB, Xxgdb, Data Display Debugger (DDD), Nemiver, KDbg, Xcode debugger, GDBtk/Insight and the HP Wildebeest Debugger GUI (WDB GUI). IDEs such as Codelite, Code::Blocks, Dev-C++, Geany, GNAT Programming Studio (GPS), KDevelop, Qt Creator, Lazarus, MonoDevelop, Eclipse, NetBeans and VisualStudio can interface with GDB. GNU Emacs has a "GUD mode" and tools for VIM exist (e.g. clewn.) These offer facilities similar to debuggers found in IDEs.
Some other debugging tools have been designed to work with GDB, such as memory leak detectors.
An example session
Consider the following source-code written in C:
Using the GCC compiler on Linux, the code above must be compiled using the -g flag in order to include appropriate debug information on the binary generated, thus making it possible to inspect it using GDB. Assuming that the file containing the code above is named example.c, the command for the compilation could be:
And the binary can now be run:
Since the example code, when executed, generates a segmentation fault, GDB can be used to inspect the problem.
The problem is present in line 8, and occurs when calling the function strlen (because its argument, s, is NULL). Depending on the implementation of strlen (inline or not), the output can be different, e.g.:
To fix the problem, the variable a (in the function main) must contain a valid string. Here is a fixed version of the code:
Recompiling and running the executable again inside GDB now gives a correct result:
GDB prints the output of printf in the screen, and then informs the user that the program exited normally.
