
 | ||
The GEH Statistic is a formula used in traffic engineering, traffic forecasting, and traffic modelling to compare two sets of traffic volumes. The GEH formula gets its name from Geoffrey E. Havers, who invented it in the 1970s while working as a transport planner in London, England. Although its mathematical form is similar to a chi-squared test, is not a true statistical test. Rather, it is an empirical formula that has proven useful for a variety of traffic analysis purposes.
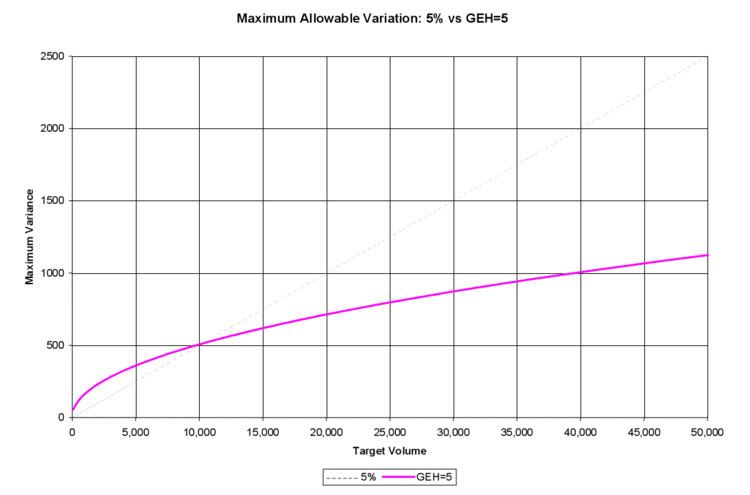
Using the GEH Statistic avoids some pitfalls that occur when using simple percentages to compare two sets of volumes. This is because the traffic volumes in real-world transportation systems vary over a wide range. For example, the mainline of a freeway/motorway might carry 5000 vehicles per hour, while one of the on-ramps leading to the freeway might carry only 50 vehicles per hour (in that situation it would not be possible to select a single percentage of variation that is acceptable for both volumes). The GEH statistic reduces this problem; because the GEH statistic is non-linear, a single acceptance threshold based on GEH can be used over a fairly wide range of traffic volumes. The use of GEH as an acceptance criterion for travel demand forecasting models is recognised in the UK Highways Agency's Design Manual for Roads and Bridges the Wisconsin microsimulation modeling guidelines, the Transport for London Traffic Modelling Guidelines and other references.
For traffic modelling work in the "baseline" scenario, a GEH of less than 5.0 is considered a good match between the modelled and observed hourly volumes (flows of longer or shorter durations should be converted to hourly equivalents to use these thresholds). According to DMRB, 85% of the volumes in a traffic model should have a GEH less than 5.0. GEHs in the range of 5.0 to 10.0 may warrant investigation. If the GEH is greater than 10.0, there is a high probability that there is a problem with either the travel demand model or the data (this could be something as simple as a data entry error, or as complicated as a serious model calibration problem).
Applications
The GEH formula is useful in situations such as the following: