
 | ||
The FluoroSpot assay is a modification of the ELISPOT assay. ELISPOT, which has become one of the most commonly used immunoassays in human clinical trials of vaccines, enumerates cells secreting a specific analyte. The method detects the analyte in the wells of a microtiter plate by the use of an enzyme-labeled antibody and a precipitating enzyme substrate for color development. As the secreted analyte is captured on the PVDF membrane in the bottom of the wells, each secreting cell will create a visible spot on the well membrane. The number of spots in relation to the number of added cells in the well will give the frequency of secreting cells. The use of substrate in the assay usually limits the method to analysis of a single analyte at a time. The FluoroSpot technique overcomes this limitation by using fluorophores instead of enzymes and takes the method closer to multiplex analysis. By assigning a certain fluorophore to the detection of a certain analyte, cells secreting several analytes will create multicolored spots on the well membrane. When analyzed by an automated FluoroSpot plate reader with selective filters, fluorophore/analyte-specific images of a well can be captured. A digital overlay of the spot-containing images enables detection of single cells secreting several analytes simultaneously. The method can be applied to essentially any type of cells where one wants to investigate secretion of multiple analytes from single cells in a population or where one simply wants to benefit from the fact that several analytes can be assessed simultaneously in the same well, for example when there is a limited supply of cells.
Contents
- Principle and procedure
- Analysis
- Triple FluoroSpot
- Biological effects of cytokine absorption
- B cell FluoroSpot
- References
The use of fluorophores instead of enzymes for the detection also makes the method more comparable to flow cytometry. Importantly, the methods differ in that flow cytometry detects intracellularly accumulated analytes and simultaneously offers the opportunity to define cell surface markers. FluoroSpot, on the other hand, detects actively secreting cells and is, like ELISpot, more adaptable to screening of large number of samples, e.g. in vaccination trials. The high sensitivity of the method (detection limit <1 cell per 100 000) makes it especially attractive in situations where the producing cells represent only a small fraction of a cell population like in studies of antigen-specific polyfunctional T cells, identification of functionally defined T-cell subtypes such as Th1, Th2, Th17 or Th22, or in studies of antigen-specific B cells and Epstein-Barr specific clinical secreting different isotypes or subclasses.
FluoroSpot has been used to analyze T cell responses in studies of TB, HIV and in influenza vaccine trial monitoring. The assay has also been used to study responses by in vivo activated human and mouse B cells and to delineate monocyte subpopulations by their cytokine secreting profile.
Principle and procedure
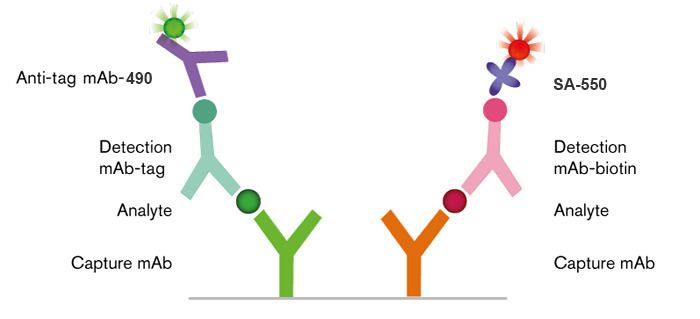
The principle of detection in FluoroSpot is shown in Figure 1. To illustrate the principle and the assay procedure, a cell secreting two different analytes (IFN-γ and IL-2) is chosen for simplicity. To detect such a cell, capture antibodies, specific for the two cytokines are coated onto the low fluorescent PVDF membranes of a 96-well microtiter plate. Subsequently, cells are added and stimulated for an appropriate period of time, typically 24–48 hours. Following a wash to remove the cells, a mixture of two detection antibodies is added. These antibodies are specific for the two secreted cytokines but directed to epitopes different from those targeted by the coating antibodies. To enable a separated detection, the two anti-cytokine antibodies are labelled with different tags e.g. biotin and FITC. The secreted cytokines are finally visualized by the addition of a mixture of Streptavidin and anti-FITC antibody labelled with different fluorophores. When excited by light from e.g. a Xenon short arc lamp the fluorophores will emit light of different wavelength, e.g. red and green filtered through emission filters. The membrane of each well will thus contain a mixture of green and red spots representing cells which have secreted either one or both of the cytokines. A cell which has secreted both cytokines will give rise to a green and a red spot at the same position on the membrane.
Analysis
To analyze the frequency of single and double-secreting cells, an automated FluoroSpot reader is preferred. Most readers today are equipped with excitation and emission filters for several fluorophores, a camera that captures images of spots visualized by each fluorophore filter and software that detects single and co-localized fluorescent spots. Spots representing dual secreting cells will appear yellow in a computerized overlay of green and red spot images (see Fig 2). The calculated number of dual-secreting cells is not based on color but rather on green and red spots at the same position in the overlays as determined by the FluoroSpot software. The frequencies of responding single and double secreting cells are obtained by counting the number of spots in stimulated cultures and in control cultures without stimulus. To control for false positive double-stained spots caused by adjacent single-secreting cells, a green image from one well and a red image from another well can be subjected to an overlay analysis. Such measures are important if high spot numbers coincide with low frequencies of double-stained cells.
Triple FluoroSpot
Cells secreting three or even more cytokines/analytes in a chosen population can be analyzed by extending the number of coating and detecting antibodies using specific tags and matching anti-tag antibodies with different fluorophores. Spots with matching coordinates (co-localized) in two- or three-filter images are defined as double and triple spots respectively. Figure 3 shows a three-color FluoroSpot exemplified by T cells secreting IFN-γ, IL-17A and IL-22.
Biological effects of cytokine absorption
When capture mAbs to different cytokines are coated in the same well, the absorption of one cytokine may influence the production of another cytokine. The effect is primarily dependent on the nature of the stimuli used and the type of cells studied. It can be estimated in the system being investigated by running cells in single coated wells. Certain cytokine combinations are more prone to this effect. One example is the capture of IL-2 in recall antigen-induced responses which has a negative effect on e.g. IFN-γ or IL-5 measured simultaneously. To compensate for the decrease in available IL-2, antibodies to CD28 can be used to provide a co-stimulatory signal for the cells in order to restore the production of IFN-γ.
B-cell FluoroSpot
In addition to T cells the FluoroSpot assay can be used with a variety of other cell types like B cells or innate immune cells such as macrophages, monocytes or dendritic cells.
FluoroSpot analysis of B cells offers the possibility to enumerate cells secreting antibodies of different isotypes or subclasses in the same well thereby saving cell sample material. Due to the relatively large amounts of immunoglobulin secreted by a single B cell, detection antibodies can often be directly labeled with fluorophores. Major application areas are analysis of B-cell responses in various diseases and those elicited by vaccination. Figure 4 shows an example of a response to swine flu (H1N1) where the number of antigen-specific IgA- and IgG-secreting cells was studied before and after vaccination with Pandemrix.