
 | ||
Fluctuation X-ray scattering (FXS) is an X-ray scattering technique similar to small-angle X-ray scattering (SAXS), but is performed using X-ray exposures below sample rotational diffusion times. This technique, ideally performed with an ultra-bright X-ray light source, such as a free electron laser, results in data containing significantly more information as compared to traditional scattering methods.
Contents
- Overview
- Mathematical background
- Basic relations
- Structure determination from FXS data
- Algebraic phasing
- Reverse Monte Carlo
- Multi tiered iterative phasing
- References
FXS can be used for the determination of (large) macromolecular structures, but has also found applications in the characterization of metallic nanostructures, magnetic domains and colloids.
The most general setup of FXS is a situation in which fast diffraction snapshots of models are taken which over a long time period undergo a full 3D rotation. A particularly interesting subclass of FXS is the 2D case where the sample can be viewed as a 2-dimensional system with particles exhibiting random in-plane rotations. In this case, an analytical solution exists relation the FXS data to the structure. In absence of symmetry constraints, no analytical data-to-structure relation for the 3D case is available, although various iterative procedures have been developed.
Overview
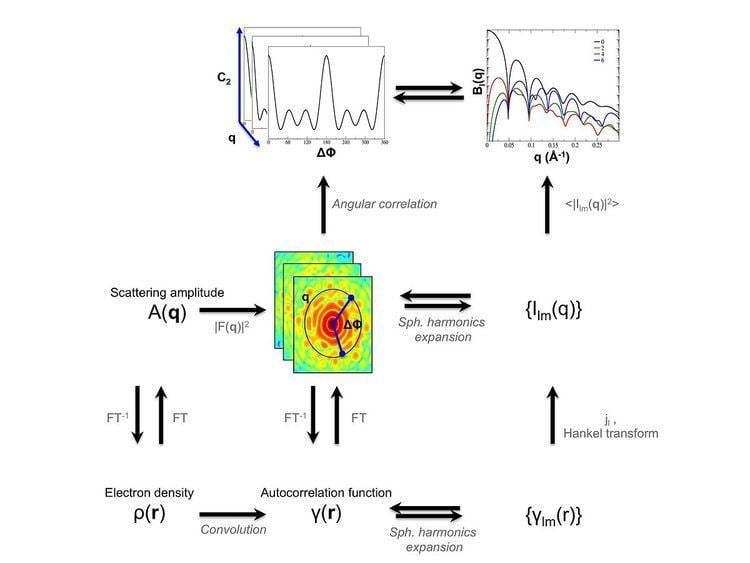
An FXS experiment consists of collecting a large number of X-ray snapshots of samples in a different random configuration. By computing angular intensity correlations for each image and averaging these over all snapshots, the average 2-point correlation function can be subjected to a finite Legendre transform, resulting in a collection of so-called Bl(q,q') curves, where l is the Legendre polynomial order and q / q' the momentum transfer or inverse resolution of the data.
Mathematical background
Given a particle
The intensity function corresponding to the complex structure factor is equal to
where
The average angular intensity correlation as obtained from many diffraction images
It can be shown that:
where
with
Additional relations can be obtained by obtaining the real space autocorrelation
A subsequent expansion of
A concise overview of these relations has been published elsewhere
Basic relations
A generalized Guinier law describing the low resolution behavior of the data can be derived from the above expressions:
Values of
The falloff of the data at higher resolution is governed by Porod laws. It can be shown that the Porod laws derived for SAXS/WAXS data hold here as well, ultimately resulting in:
for particles with well-defined interfaces.
Structure determination from FXS data
Currently, there are three routes to determine molecular structure from its corresponding FXS data.
Algebraic phasing
By assuming a specific symmetric configuration of the final model, relations between expansion coefficients describing the scattering pattern of the underlying species can be exploited to determine a diffraction pattern consistent with the measure correlation data. This approach has been shown to be feasible for icosahedral and helical models.
Reverse Monte Carlo
By representing the to-be-determined structure as an assembly of independent scattering voxels, structure determination from FXS data is transformed into a global optimisation problem and can be solved using simulated annealing.
Multi-tiered iterative phasing
The multi-tiered iterative phasing algorithm (M-TIP) overcomes convergence issues associated with the reverse Monte Carlo procedure and eliminates the need to use or derive specific symmetry constraints as needed by the Algebraic method. The M-TIP algorithm utilizes non-trivial projections that modifies a set of trial structure factors