I love Blogging, helping others, making
something out of nothing !!!!!!
Flow visualization
Updated on
Edit
Like
Comment
Share
Sign in
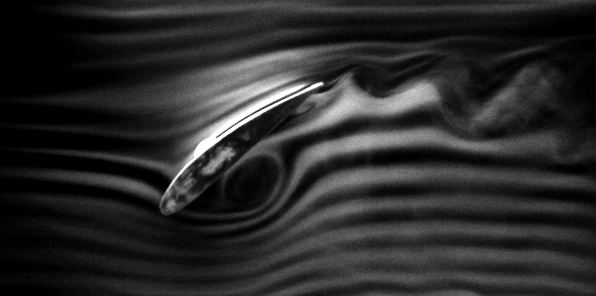
Flow visualization or flow visualisation in fluid dynamics is used to make the flow patterns visible, in order to get qualitative or quantitative information on them.
Flow visualization is the art of making flow patterns visible. Most fluids (air, water, etc.) are transparent, thus their flow patterns are invisible to the naked eye without methods to make them visible.
Historically, such methods included experimental methods. With the development of computer models and CFD simulating flow processes (e.g. the distribution of air-conditioned air in a new car), purely computational methods have been developed.
Methods of visualization
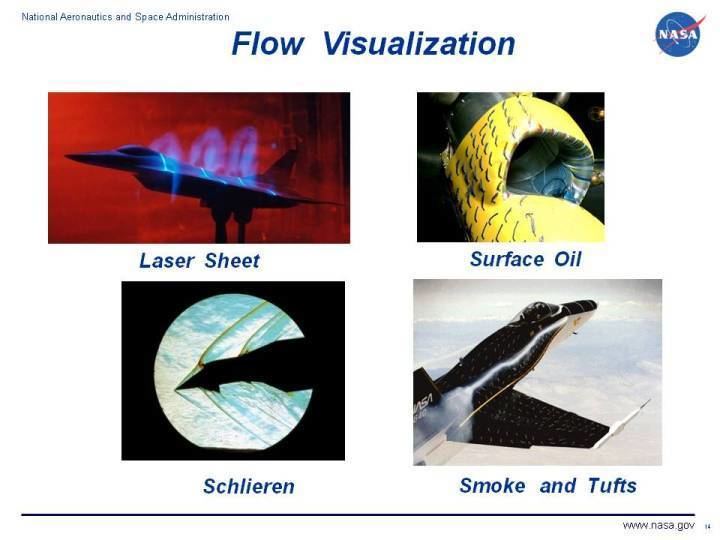
In experimental fluid dynamics, flows are visualized by three methods:
Surface flow visualization: This reveals the flow streamlines in the limit as a solid surface is approached. Colored oil applied to the surface of a wind tunnel model provides one example (the oil responds to the surface shear stress and forms a pattern).
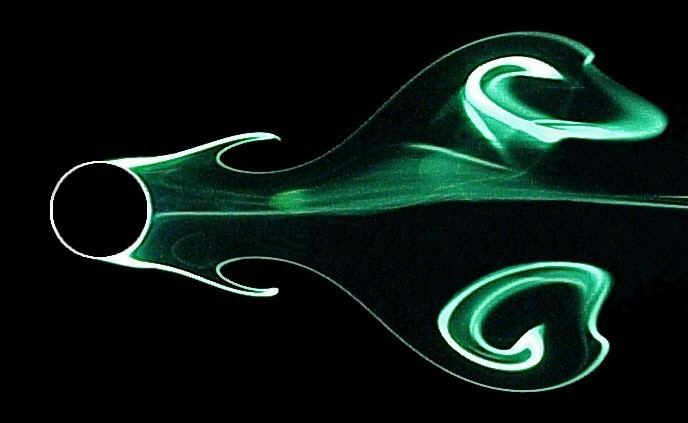
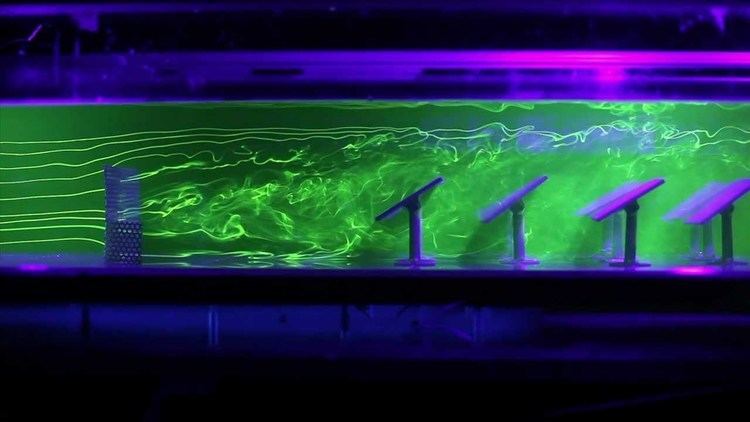
Particle tracer methods: Particles, such as smoke or microspheres, can be added to a flow to trace the fluid motion. We can illuminate the particles with a sheet of laser light in order to visualize a slice of a complicated fluid flow pattern. Assuming that the particles faithfully follow the streamlines of the flow, we can not only visualize the flow but also measure its velocity using the particle image velocimetry or particle tracking velocimetry methods. Particles with densities that match that of the fluid flow will exhibit the most accurate visualization.
Optical methods: Some flows reveal their patterns by way of changes in their optical refractive index. These are visualized by optical methods known as the shadowgraph, schlieren photography, and interferometry. More directly, dyes can be added to (usually liquid) flows to measure concentrations; typically employing the light attenuation or laser-induced fluorescence techniques.
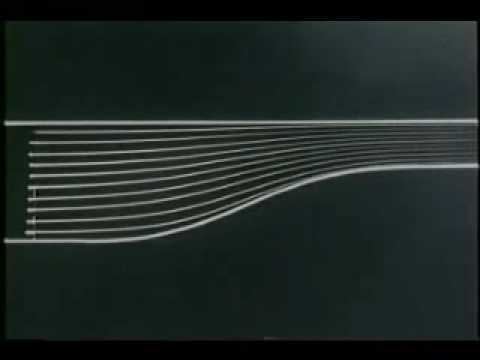
Analytical methods, that analyse a given flow and show properties like streamlines, streaklines, and pathlines. The flow can either be given in a finite representation or as a smooth function.
Texture advection methods that "bend" textures (or images) according to the flow. As the image is always finite (the flow though could be given as a smooth function), these methods will visualize approximations of the real flow.
Application
In computational fluid dynamics the numerical solution of the governing equations can yield all the fluid properties in space and time. This overwhelming amount of information must be displayed in a meaningful form. Thus flow visualization is equally important in computational as in experimental fluid dynamics.