
 | ||
Quartz is a very common crustal mineral that undergoes crystal plastic deformation over a wide range of conditions, and there are many descriptions of its deformation microstructures and crystallographic preferred orientation (CPO) from a wide variety of metamorphic grades, strain geometries and finite strains. From both the experiments and simulations, it is possible to obtain information from the fabrics that develop during deformation histories. For example, in progressive simple shear the fabric skeleton becomes asymmetric relative to the sense of shear. The fabric orientation and characteristics are controlled by the kinematic framework and bear only an indirect relationship to the finite strain accumulated to that point in the history.
Contents
- Quartz structure
- Deformation Mechanisms
- Experimentally Sheared Quartzite
- The C axis Pole Figures
- C axis pole figures evolution
- Computer Simulation Quartzite
- Models
- C axis fabric development
- References
The c-axis pole figure evolves from a broad peripheral maximum indicative of basal <a> slip, to an inclined single girdle with two maxima indicative of rhomb <a> slip, and finally an elongate single maximum at the girdle center indicative of prism <a> slip; throuthout this sequence the fabric skeleton rotates with the sense of shear.
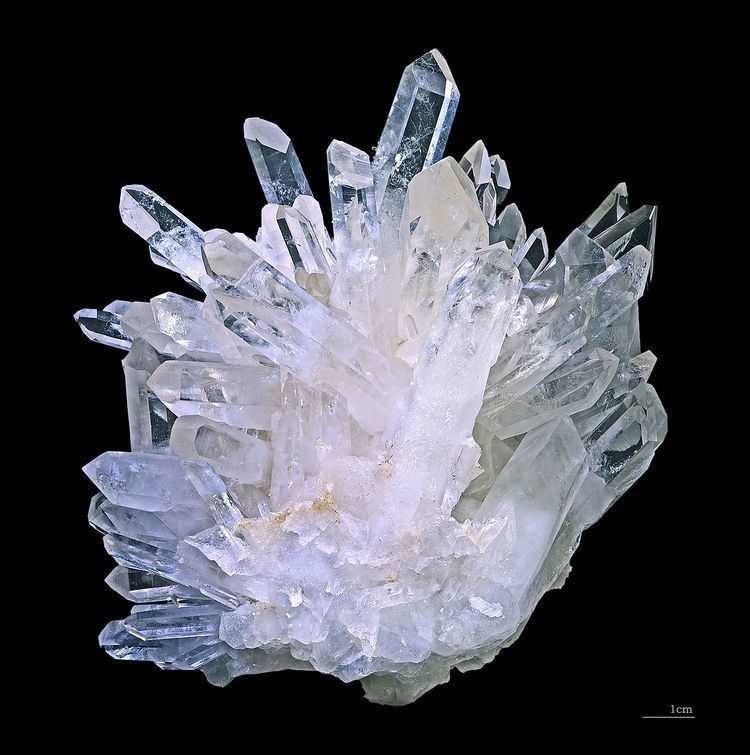
Quartz structure
Quartz is made up of SiO4 with an atoms frame of silicon–oxygen tetrahedra. Each oxygen is shared between two tetrahedra, giving an overall formula of SiO2. Quartz is part of the trigonal crystal system which is a subsystem of the hexagonal crystal system. As shown in the figure, quartz has four axes: a1=a2=a3≠c. The a-axes lie in a plane at a 120°angle from each other and the c-axis is perpendicular to the plane of a-axes.
Deformation Mechanisms
With increasing temperature and decreasing strain rate, quartz deformation can yield numerous microsturctures. Each microstructures represents different deformational process and condition which is grouped into three regimes: Bulging (BLG), Subgrain Rotation (SGR), and Grain Boundary Migration (GBM). As the deformation mechanisms changes from BLG, SGR, to GBM, the recrystallized grain sizes becomes larger. The dynamic recovery and recrystallisation is the result of two processes: Subgrain Rotation and Grain Boundary Migration. Subgrain rotation means as the dislocation moves into the subgrain wall,the misorientation angle between two subgrains increases. Grain Boundary Migration makes the diffusion from one side of a grain boundary to the other happen.
Experimentally Sheared Quartzite
Dynamic quartz recrystallization can not only produce different types of microstructures, but also plays a crucial role during texture evolution. Samples sheared at higher temperatures, where dynamic recrystallization of subgrain rotation and grain boundary migration occurs, and with shear strains up to 8 develop different c-axis crystallographic preferred orientations.
The C-axis Pole Figures
The bulk C-axis pole figures (a) of the sheared samples on the top of the figure were calculated using the CIP method (computer-integrated polarization microscopy). Shear plane is horizontal and shear sense is sinistral. The pole figure maximum (CPOmax) and the rotation angle of skeleton axis relative to shear plane normal are indicated above and below each pole figure. The superposed straight line indicates the skeleton axis. As shear strain increases,there is a noticeable change in the pattern, from a broad peripheral maximum with its center against the shear sense, to a peripheral maximum that extends inward toward the pole figure center defining an axis that is rotated with the sense of shear, to a narrow single girdle rotated more strongly with the sense of shear that contains 2 elongate maxima at intermediate positions and, at the highest strain, a single maximum at the center. The visually estimated skeleton axis shows a progressive increase of θwith increasing shear strain, although the rate of increase is relatively low for γ≥ 5. It is obviously that there is a strong increase for γ>4,corresponding to the achievement of significant recrystallization and the development of the single girdle and single maximum pattern.
C-axis pole figures evolution
Figure (b) is a schematic summary of the evolution of the c-axis pole figure as a function of the estimated shear strain γ. The pole figure in the inset box shows c-axis positions which put the three possible slip planes: base,rhombs, prism close to the shear plane and the slip direction <a> close to the shear direction. All pole figures are upper hemisphere projection. There are two overlapping maxima at low shear strain: one is a very hard orientation in the direction of σ1, inclined at 45° to the shear plane, and the other one corresponds to basal slip which is normal to the shear plane. At γ~2, with~50% of the material recrystallized, there is a single maximum in an orientation favoring basal slip; the skeleton axis is rotated slightly with the sense of shear.The peripheral maximum starts to extend toward the center of the pole figure with further increase of strain and recrystallized volume, beginning to define an inclined single girdle and including grains favorably oriented for rhomb slip. At high strain and with nearly complete recrystallization, an inclined single girdle develops which contains two strong maxima in orientations favorable for rhomb slip. Finally, with complete recrystallization and at the highest strain attained in this study, a central maximum is formed within the inclined girdle, indicating prism slip. As a result,with increasing shear strain and increasing percent recrystallization there is both a progressive rotation,θ, of the fabric skeleton with the sense of shear, and a progressive migration in the position of the c-axis maxima within the skeleton, from more peripheral orientations consistent with basal <a> slip to more central positions consistent with rhomb <a> and finally prism <a> slip.
Computer Simulation Quartzite
Intracrystalline slip plays an important role in plastic deformation of polycrystalline material and the crystal axes tend to rotate and a pattern of preferred orientation can develop. As a result, the crystal axes can act as an internal reference frame during deformation. In order to apply a computer program based on the Taylor-Bishop-Hill analysis, three factors have been found to affect the development of deformation fabrics: (1) The initial orientation distribution; (2) the deformation history by which the final deformed state was achieved; and (3) the dislocation glide systems and combination s of glide systems that operate to allow deformation.
Models
Before an individual mechanism are able to operate, dislocation glide systems and critical yield stresses need to be specified for a fabric simulation. The relative values of the critical yield stresses govern the development of fabric.The table below shows critical resolved shear stress(CRSS) values used for each of the three model quartzites.
C-axis fabric development
The figure to the right shows the c-axis fabrics developed during progressive simple shear for each model quartzite.
There are also some other characteristics that need to be noted.
- With increasing strain, pattern concentrations become more intense. For model B, after a shear strain of about 3, a steady state concentration is attained.
- After a certain shear strain, definite asymmetry appears in the orientation distribution and in the skeletal outline of the fabric. At low shear strain the asymmetry is not marked, and it would be possible to ascribe an orthorhombic symmetry to the fabric skeleton.
- The c-axis concentrations have a leading edge which is sharply defined and is orthogonal both to the flow plane and the flow direction. For models A and C, a significant number of basal planes align themselves precisely in the flow plane.
- Both model A and C develop a c-axis girdle precisely orthogonal to the flow plane and direction.