
Passenger-miles/imperial gallon 17 Passenger-miles/US gallon 14 Litres/100 passenger-km 16.6 | 17 109 14 91 16.6 3.1 | |
 | ||
Energy efficiency in transportation is, strictly speaking, useful output (kilometers, miles, etc.) divided by total energy input (kilowatt-hour, amount of gasoline, etc.). This is more precisely known as fuel economy (symbol FE), and commonly measured in units of km/L or mi/gal (MPG).
Contents
- Units of measurement
- Transportation types
- Walking
- Velomobile
- Bicycling
- Human power
- Automobiles
- Example consumption figures
- Aircraft
- Small aircraft
- Queen Elizabeth
- Cruise ships
- Emma Maersk
- Sailboats
- Trains
- Freight
- Passenger
- Braking losses
- Other references
- Buses
- Other
- European Public transport
- US Passenger transportation
- US Freight transportation
- Canadian transportation
- French environmental calculator
- References
Energy efficiency in transportation is often (and confusingly) described in terms of fuel consumption (symbol FC). Fuel consumption is the reciprocal of fuel economy and is occasionally known as energy intensity; it equals fuel (energy) divided by distance, and is often measured in units of liters per 100 kilometers (L/100 km), joules per kilometer (J/km), gallon-equivalent per 100 miles (gale/100 mi), or kilowatt-hours per distance (kW-hr/km or kW-hr/mi).
The energy efficiency in transportation varies by mode of transportation (listed below). Different types of transportation range from some hundred kilojoules per kilometre (kJ/km) for a bicycle to tens of megajoules per kilometer (MJ/km) for a helicopter.
Units of measurement
Both fuel economy and fuel consumption are often given on a per-vehicle basis. More refined units of measurement exist, such as fuel consumption per passenger or fuel consumption per mass of cargo.
Energy efficiency is expressed in terms of fuel economy:
Energy intensity (reciprocal efficiency) is expressed terms of fuel consumption:
Transportation types
For freight transport, rail and ship transport are generally much more efficient than trucking, and air freight is much less efficient.
Walking
A 68 kg (150 lb) person walking at 4 km/h (2.5 mph) requires approximately 210 kilocalories (880 kJ) of food energy per hour, which is equivalent to 4.55 km/MJ. 1 US gal (3.8 L) of gasoline contains about 114,000 British thermal units (120 MJ) of energy, so this is approximately equivalent to 360 miles per US gallon (0.65 L/100 km).
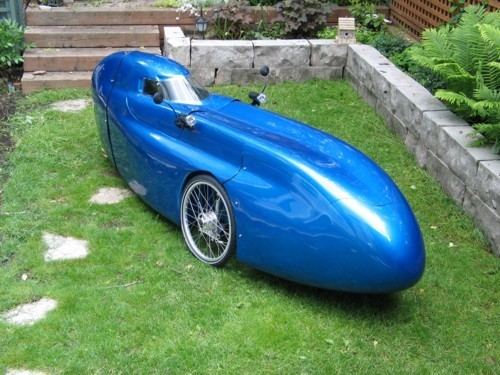
Velomobile
Velomobiles have the highest energy efficiency of any known mode of personal transportation. At a speed of 50 km/h (31 mph), the velomobile manufacturer WAW claims that only 0.5 kW·h of food energy per 100 km is needed to transport the passenger, which is around 1⁄5 (20%) of what is needed to power a standard upright bicycle, and 1⁄50 (2%) of that which is consumed by an average fossil fuel or electric car. This corresponds to 4700 miles per US gallon (2000 km/L, 0.05 L/100 km). Other sources give a figure of 1⁄3.4 (29.5%) of the energy use of a normal bicycle.
Bicycling
A lightweight and moderate-speed vehicle with low-friction tires and an efficient chain-driven drivetrain, the bicycle is one of the most energy-efficient forms of transportation. Compared with walking, a 64 kg (140 lb) cyclist riding at 16 km/h (10 mph) requires about half the food energy per unit distance: 43 kcal/mi, 27 kcal/km or 3.1 kW·h (11 MJ) per 100 km. This converts to about 732 mpg‑US (0.321 L/100 km; 879 mpg‑imp). This means that a bicycle will use between 10-25 times less energy per distance traveled than a personal car, depending on fuel source and size of the car. This figure does depend on the speed and mass of the rider: greater speeds give higher air drag and heavier riders consume more energy per unit distance. In addition, because bicycles are very lightweight (usually between 7-15 kg) this means they consume very low amounts of materials and energy to manufacture, especially in comparison to an automobile weighing 1500kg or more. This means that a bicycle typically requires 100-200 times less energy to produce than an automobile, which for an automobile can make up a large portion of its total energy use (as discussed below in the automobile section).
A motorized bicycle allows human power and the assistance of a 49 cm3 (3.0 cu in) engine, giving a range of 160 to 200 mpg‑US (1.5–1.2 L/100 km; 190–240 mpg‑imp). Electric pedal-assisted bikes run on as little as 1.0 kW·h (3.6 MJ) per 100 km, while maintaining speeds in excess of 30 km/h (19 mph). These best-case figures rely on a human doing 70% of the work, with around 3.6 MJ (1.0 kW·h) per 100 km coming from the motor. This makes an electric bicycle one of the most efficient possible motorized vehicles, behind only a motorized velomobile.
Human power
To be thorough, a comparison must also consider the energy costs of producing, transporting and packaging of fuel (food or fossil fuel), the energy incurred in disposing of exhaust waste, and the energy costs of manufacturing the vehicle. This last can be significant given that walking requires little or no special equipment, while automobiles, for example, require a great deal of energy to produce and have relatively short lifespans. In addition, any comparison of electric vehicles and liquid-fuelled vehicles must include the fuel consumed in the power station to generate the electricity. In the UK for instance the efficiency of the electricity generation and distribution system is around 0.40.
Automobiles
Automobile fuel efficiency is most commonly expressed in terms of the volume of fuel consumed per one hundred kilometres (L/100 km), but in some countries (including the USA, UK and India) it is more commonly expressed in terms of the distance per volume fuel consumed (km/L or miles per US or imperial gallon). This is complicated by the different energy content of fuels such as petrol and diesel. The Oak Ridge National Laboratory (ORNL) states that the energy content of unleaded gasoline is 115,000 British thermal unit (BTU) per US gallon (32 MJ/L) compared to 130,500 BTU per US gallon (36.4 MJ/L) for diesel.
A second important consideration is the energy costs of producing energy. Bio-fuels, electricity and hydrogen, for instance, have significant energy inputs in their production. Because of this, the efficiency of 50-70% (from natural gas) or 10-15% (from electricity) of hydrogen production, as well as the vast amounts of energy required to store and transport hydrogen must to be combined with the vehicle efficiency to yield net efficiency.Because of this, hydrogen automobiles are one of the least efficient means of passenger transportation, generally around 50 times as much energy must be put into the production of hydrogen compared to how much is used to move the car.
A third consideration to take into account is the occupancy rate of the vehicle. As the number of passengers per vehicle increases the consumption per unit distance per vehicle increases. However this increase is slight compared to the reduction in consumption per unit distance per passenger. We can compare, for instance, the estimated average occupancy rate of about 1.3 passengers per car in the San Francisco Bay Area to the 2006 UK estimated average of 1.58.
Fourth, the energy needed to build and maintain roads is an important consideration, as is the energy returned on energy invested (EROEI). Between these two factors, roughly 20% must be added to the energy of the fuel consumed, to accurately account for the total energy used.
Finally, vehicle energy efficiency calculations would be misleading without factoring the energy cost of producing the vehicle itself. This initial energy cost can of course be depreciated over the life of the vehicle to calculate an average energy efficiency over its effective life span. In other words, vehicles that take a lot of energy to produce and are used for relatively short periods will require a great deal more energy over their effective lifespan than those that do not, and are therefore much less energy efficient than they may otherwise seem. Hybrid and electric cars use less energy in their operation than comparable petroleum-fueled cars but more energy is used to manufacture them, so the overall difference would be less than immediately apparent. Compare, for example, walking, which requires no special equipment at all, and an automobile, produced in and shipped from another country, and made from parts manufactured around the world from raw materials and minerals mined and processed elsewhere again, and used for a limited number of years. According to the French energy and environment agency ADEME, an average motor car has an embodied energy content of 20,800 kWh and an average electric vehicle amounts to 34,700 kWh. The electric car requires nearly twice as much energy to produce, primarily due to the large amount of mining and purification necessary for the rare earth metals and other materials used in lithium-ion batteries and in the electric drive motors. This represents a significant portion of the energy used over the life of the car (in some cases nearly as much as energy that is used through the fuel that is consumed, effectively doubling the car's per-distance energy consumption), and cannot be ignored when comparing automobiles to other transportation modes. It is important to note, also, that as these are average numbers for French automobiles and they are are likely to be significantly larger in more auto-centric countries like the United States and Canada, where much larger and heavier cars are more common.
Driving practices and vehicles can be modified to improve their energy efficiency by about 15%.
On a percentage basis, if there is one occupant in an automobile, between 0.4-0.6% of the total energy used is used to move the person in the car, while 99.4-99.6% (about 165 to 250 times more) is used to move the car.
Example consumption figures
Aircraft
A principal determinant of energy consumption in aircraft is drag, which must be opposed by thrust for the aircraft to progress.
Passenger airplanes averaged 4.8 l/100 km per passenger (1.4 MJ/passenger-km) (49 passenger-miles per gallon) in 1998. Note that on average 20% of seats are left unoccupied. Jet aircraft efficiencies are improving: Between 1960 and 2000 there was a 55% overall fuel efficiency gain (if one were to exclude the inefficient and limited fleet of the DH Comet 4 and to consider the Boeing 707 as the base case). Most of the improvements in efficiency were gained in the first decade when jet craft first came into widespread commercial use. Compared to advanced piston engine airliners of the 1950s, current jet airliners are only marginally more efficient per passenger-mile. Between 1971 and 1998 the fleet-average annual improvement per available seat-kilometre was estimated at 2.4%. Concorde the supersonic transport managed about 17 passenger-miles to the Imperial gallon; similar to a business jet, but much worse than a subsonic turbofan aircraft. Airbus puts the fuel rate consumption of their A380 at less than 3 l/100 km per passenger (78 passenger-miles per US gallon).
The mass of an aircraft can be reduced by using light-weight materials such as titanium, carbon fiber and other composite plastics. Expensive materials may be used, if the reduction of mass justifies the price of materials through improved fuel efficiency. The improvements achieved in fuel efficiency by mass reduction, reduces the amount of fuel that needs to be carried. This further reduces the mass of the aircraft and therefore enables further gains in fuel efficiency. For example, the Airbus A380 design includes multiple light-weight materials.
Airbus has showcased wingtip devices (sharklets or winglets) that can achieve 3.5 percent reduction in fuel consumption. There are wingtip devices on the Airbus A380. Further developed Minix winglets have been said to offer 6 percent reduction in fuel consumption. Winglets at the tip of an aircraft wing smooth out the wing-tip vortex (reducing the aircraft's wing drag) and can be retrofitted to any airplane.
NASA and Boeing are conducting tests on a 500 lb (230 kg) "blended wing" aircraft. This design allows for greater fuel efficiency since the whole craft produces lift, not just the wings. The blended wing body (BWB) concept offers advantages in structural, aerodynamic and operating efficiencies over today's more conventional fuselage-and-wing designs. These features translate into greater range, fuel economy, reliability and life cycle savings, as well as lower manufacturing costs. NASA has created a cruise efficient STOL (CESTOL) concept.
Fraunhofer Institute for Manufacturing Engineering and Applied Materials Research (IFAM) have researched a shark skin imitating paint that would reduce drag through a riblet effect. Aircraft are a major potential application for new technologies such as aluminium metal foam and nanotechnology such as the shark skin imitating paint.
Propfan propulsors are a more fuel efficient technology than jets or turboprops, but turboprops have an optimum speed below about 450 mph (700 km/h). This speed is less than used with jets by major airlines today. However, the decrease in speed reduces drag. With the current high price for jet fuel and the emphasis on engine/airframe efficiency to reduce emissions, there is renewed interest in the propfan concept for jetliners that might come into service beyond the Boeing 787 and Airbus A350XWB. For instance, Airbus has patented aircraft designs with twin rear-mounted counter-rotating propfans. NASA has conducted an Advanced Turboprop Project (ATP), where they researched a variable pitch propfan that produced less noise and achieved high speeds.
Related to fuel efficiency is the impact of aviation emissions on climate.
Small aircraft
Queen Elizabeth
Cunard stated that Queen Elizabeth 2 travelled 49.5 feet per imperial gallon of diesel oil (3.32 m/l or 41.2 ft/US gal), and that it had a passenger capacity of 1777. Thus carrying 1777 passengers we can calculate an efficiency of 16.7 passenger miles per imperial gallon (16.9 l/100 p·km or 13.9 p·mpg–US).
Cruise ships
MS Oasis of the Seas has a capacity of 6,296 passengers and a fuel efficiency of 14.4 passenger miles per US gallon. Voyager-class cruise ships have a capacity of 3,114 passengers and a fuel efficiency of 12.8 passenger miles per US gallon.
Emma Maersk
Emma Maersk uses a Wärtsilä-Sulzer RTA96-C, which consumes 163 g/kW·h and 13,000 kg/h. If it carries 13,000 containers then 1 kg fuel transports one container for one hour over a distance of 45 km. The ship takes 18 days from Tanjung (Singapore) to Rotterdam (Netherlands), 11 from Tanjung to Suez, and 7 from Suez to Rotterdam, which is roughly 430 hours, and has 80 MW, +30 MW. 18 days at a mean speed of 25 knots (46 km/h) gives a total distance of 10,800 nautical miles (20,000 km).
Sailboats
A sailboat, much like a solar car, can locomote without consuming any fuel. A sail boat such as a Dinghy using just wind power requires no input energy in terms of fuel. However some manual energy is required by the crew to steer the boat and adjust the sails using ropes. In addition energy will be needed for demands other than propulsion, such as cooking, heating or lighting. The fuel efficiency of a single-occupancy boat is highly dependent on the size of its engine, the speed at which it travels, and its displacement. Due to the high viscosity of water, with a single passenger, the equivalent energy efficiency will be lower than in a car, train, or plane.
Trains
Trains are in general one of the most efficient means of transport for freight and passengers. Efficiency varies significantly with passenger loads, and losses incurred in electricity generation and supply (for electrified systems), and, importantly, end-to-end delivery, where stations are not the originating final destinations of a journey.
Actual consumption depends on gradients, maximum speeds, loading and stopping patterns. Data produced for the European MEET project (Methodologies for Estimating Air Pollutant Emissions) illustrate the different consumption patterns over several track sections. The results show the consumption for a German ICE high-speed train varied from around 19 to 33 kW·h/km (68–119 MJ/km; 31–53 kW·h/mi). The data also reflects the weight of the train per passenger. For example, TGV double-deck Duplex trains use lightweight materials, which keep axle loads down and reduce damage to track and also save energy.
Freight
Energy consumption estimates for rail freight vary widely, and many are provided by interested parties. Some are tabulated below.
Passenger
Considering only the energy spent to move the train, and taking as example the urban area of Lisbon, train seems to be on average 20 times more efficient than automobile for transportation of passengers, if we consider energy spent per passenger-km. Considering an automobile which has a consumptions of around 6 l/100 km (47 mpg‑imp; 39 mpg‑US) of gasoline, the fact the on average cars in Europe have an occupation ratio of around 1.2 passengers per automobile and that one litre of gasoline amounts for about 8826 Wh, one gets on average 441 Wh (1,590 kJ) per passenger-km. On the other hand, a modern urban train with an average occupation of 20% of total capacity, which has a consumption of about 8.5 kW·h/km (31 MJ/km; 13.7 kW·h/mi), one gets 21.5 Wh per passenger-km, 20 times less than the automobile.
Braking losses
Stopping is a considerable source of inefficiency. Modern electric trains like the Shinkansen (the Bullet Train) use regenerative braking to return current into the catenary while they brake. A Siemens study indicated that regenerative braking might recover 41.6% of the total energy consumed. The Passenger Rail (Urban and Intercity) and Scheduled Intercity and All Charter Bus Industries Technological and Operational Improvements – FINAL REPORT states that "Commuter operations can dissipate more than half of their total traction energy in braking for stops." and that "We estimate head-end power to be 35 percent (but it could possibly be as high as 45 percent) of total energy consumed by commuter railways." Having to accelerate and decelerate a heavy train load of people at every stop is inefficient despite regenerative braking which can recover typically around 20% of the energy wasted in braking. Weight is a determinant of braking losses.
Other references
AEA study of road and rail for the United Kingdom Department for Transport: Final report
Buses
Other
European Public transport
Rail and bus are generally required to serve 'off peak' and rural services, which by their nature have lower loads than city bus routes and inter city train lines. Moreover, due to their 'walk on' ticketing it is much harder to match daily demand and passenger numbers. As a consequence, the overall load factor on UK railways is 35% or 90 people per train:
Conversely, airline services generally work on point-to-point networks between large population centres and are 'pre-book' in nature. Using yield management, overall load factors can be raised to around 70–90%. Intercity train operators have begun to use similar techniques, with loads reaching typically 71% overall for TGV services in France and a similar figure for the UK's Virgin Trains services.
For emissions, the electricity generating source needs to be taken into account.
US Passenger transportation
The US Transportation Energy Data Book states the following figures for passenger transportation in 2009:
US Freight transportation
The US Transportation Energy book states the following figures for freight transportation in 2010:
From 1960 to 2010 the efficiency of air freight has increased 75%, mostly due to more efficient jet engines.
1 gal-US (3.785 l, 0.833 gal-imp) of fuel can move a ton of cargo 857 km or 462 nmi by barge, or 337 km (209 mi) by rail, or 98 km (61 mi) by truck.
Compare:
Canadian transportation
Natural Resources Canada's Office of Energy Efficiency publishes annual statistics regarding the efficiency of the entire Canadian fleet. For researchers, these fuel consumption estimates are more realistic than the fuel consumption ratings of new vehicles, as they represent the real world driving conditions, including extreme weather and traffic. The annual report is called Energy Efficiency Trends Analysis. There are dozens of tables illustrating trends in energy consumption expressed in energy per passenger km (passengers) or energy per tonne km (freight).
French environmental calculator
The environmental calculator of the French environment and energy agency (ADEME) published in 2007 using data from 2005 enables one to compare the different means of transportation as regards the CO2 emissions (in terms of carbon dioxide equivalent) as well as the consumption of primary energy. In the case of an electric vehicle, the ADEME makes the assumption that 2.58 toe as primary energy are necessary for producing one toe of electricity as end energy in France (see Embodied energy#Embodied energy in the energy field).
This computer tool devised by the ADEME shows the importance of public transportation from an environmental point of view. It highlights the primary energy consumption as well as the CO2 emissions due to transportation. Due to the relatively low environmental impact of radioactive waste, compared to that of fossil fuel combustion emissions, this is not a factor in the tool. Moreover, intermodal passenger transport is probably a key to sustainable transport, by allowing people to use less polluting means of transportation.