
 | ||
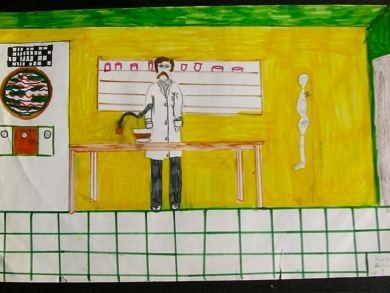
The Draw-A-Scientist Test (DAST) is an open-ended projective test designed to investigate children's perceptions of the scientist. Originally developed by David Wade Chambers in 1983, the main purpose was to learn at what age the well known stereotypic image of the scientist first appeared. Following the simple prompt, "Draw a scientist", 4807 primary school children in three countries completed drawings. The drawings were then analyzed for seven standard indicators: lab coat, eyeglasses, facial hair, symbols of research, symbols of knowledge, products of science (technology) and relevant captions. From these indicators, Chambers was able to show that children began to develop stereotypical views of scientists from a very early age, with a progressively larger number of indicators appearing as the grades progress.
Contents
History
Chambers’ original 1983 DAST, based on surveys conducted between 1966 and 1977, differs significantly, in both purpose and methodology, from the earlier Draw-A-Person and Draw-A-Man projective tests (such as Florence Goodenough in 1926; Harris,1963; Goodenow, 1977 ), which have been used as a measure of intellectual maturation, to elicit personality type and unconscious material, and as part of neuropsychologic tests for stroke victims. Chambers, rather, was responding to important essays by Margaret Mead and Rhoda Metraux, which identified typical stereotypical images of scientists in high school students, and D. C. Beardslee and D. D. O'Dowd, which was a careful examination of the college student image of the scientist.
Over the next 3 decades, several hundred researchers, mainly in the discipline of education, have used the Chambers DAST to gauge various social, cultural and educational factors in student perception of science and the scientist. Some of these variables are discussed below.
Kevin D. Finson published an extensive review of the DAST literature.
Specific disciplines and related professions
Since the publication of the DAST, several different scientific disciplines have been studied simply by changing the prompt from "Draw a scientist" to "Draw a ..." These include such professions as engineer, chemist, archeologist, psychologist, mathematician, physicist, doctor, (Schibeci & Sorensen, 1982; Hill, 1991; Warren, 1990; Flick, 1990),
Ethnicity and country
Chambers 1983 survey included children's images in French and English Canada, Australia and the United States along with a single set of drawings from the People's Republic of China. Schibeci and Sorensen (1983) used the DAST for a study of elementary children in Australia, reporting that the media, primarily television, contributed significantly to reinforcement of the stereotypical image. She (1995) administered a modified DAST to Taiwanese students (grades 1 to 8) including an analysis of how those images may be influenced by science textbooks currently in use in Taiwan. Earlier studies conducted by She showed Taiwan students held very similar stereotypical images of scientists as those in the West. Fung (2002) administered the DAST to Hong Kong Chinese students comparing primary and secondary school student’s images. A study of primary students in Ireland (Maoldomhnaigh & Hunt, 1989) revealed that not a single male student drew a female scientist and that only 23 out of 45 female students drew female scientists. Song & Kim (1999) reported that in their study of Korean students, 74 percent described their scientist as male and only 16 percent as female. Buldu (2006) administered DAST to children aged 5–8 years. None of the 24 boys drew female scientists and 5 of 13 girls drew female scientists. Sjøberg (2002) reported on images of scientists in 21 countries. Michalak (2013) reported that when Korean students were asked to depict their perception of a scientist/science from East Asia, Europe, and the Middle East, a hierarchy of time, resources and awareness immediately emerged, some regions held in much lower estimation to others. The list of countries where the DAST has been administered includes French and English Canada, United States, Brazil, Mexico, Colombia, Bolivia, Uruguay, Chile, Thailand, South Korea, Taiwan, Hong Kong, China, Japan, Australia, New Zealand, India, Nigeria, Turkey, France, Italy, Greece, Spain, Germany, Norway, Finland, Sweden, Russia, Poland, Rumania, Slovakia, Ireland and the U.K. Ethnicities studied include Navajo, Black American, Hebrew and Arab.
Methodological
A range of methodological variations of the original DAST have been developed. The Draw-a-Scientist-Test Revised Prompt (DAST-R) was recommended and tested by David Symington and Heather Spurling (1990). They pointed out that students seemed to be drawing what they perceived to be the public stereotype of a scientist, and not necessarily their own perception. To remedy this problem, Symington and Spurling tested the effect of a revised prompt, "Do a drawing which tells what you know about scientists and their work." They compared drawings done by children given both sets of prompts. The drawings showed enough differences that these researchers concluded their report with a recommendation that the DAST prompt be critically examined for what it was actually asking the students to draw. Finson, Beaver, and Cramond (1995) developed the Draw-A-Scientist Checklist (DAST-C) a revised list of indicators based mainly on those first noted in the Chambers' DAST.
Several researchers have raised other methodological issues. Jarvis & Rennie (1995) thought that the use of drawings without words could represent an abstract idea the observer may be unable to comprehend. They suggested that children be asked to add sentences or annotate their drawings to improve interpretation. Losh, Wilke & Pop (2008) felt that analysis of the DAST is weakened by asking children to draw ‘only scientists’, suggesting that it is unlikely children view scientists as different from other professionals especially in absence of comparison across occupations. Maoldomhnaigh & Hunt (1989) reported that when they asked their subjects to draw two pictures of scientists the frequency of appearance of mythic stereotypes changed from one set of representations to the other leading them to conclude that students might have more than one definition of the word “scientist”. Maoldomhnaigh & Mholain (1990) cautioned that greater care be taken in the standardization of task directions provided to children since different wording could produce differences in the drawings. Chambers responded to these objections by pointing out that, although revised prompts may be very useful in relation to certain revised research objectives, the aims of the original study were well served by using the simplest of prompts to avoid confusion and possible inadvertent signaling to the children of 'what was expected'. Also, since the DAST was first designed to discover at what age the well-known stereotype first appeared, the use of words was not really appropriate when dealing with younger children of limited verbal capacity. Finally, Chambers believed the use of a standardized prompt was desirable to ensure that different studies, across cultures and across time, remain comparable. (Chambers, 1996)
Gender
The single most widely studied variable in DAST research has been that of gender. Mead and Metraux (1957) noted that when asked to write essays about scientists, both male and female high school students mostly described male scientists. In the original DAST study, out of nearly 5,000 students tested, 28 girls, and no boys, drew female scientists. (See also Schibeci and Sorenson, 1984; Kelly 1985). To a greater or lesser degree, almost all the hundreds of DAST studies observed this gender divide, as indicated in a recent review of the DAST literature.
"A survey of students from across the United States found that only 14 percent of the drawings by girls and 8 percent of the drawings by boys depicted female scientists, and only 20 of the 1,600 drawings by both girls and boys depicted scientists of color (Fort and Varney 1989). A study of undergraduate biology and liberal studies majors showed that students in both groups drew more male scientists than female scientists, and only female students from both groups drew female scientists (Rosenthal 1993). Another study found that children in kindergarten through twelfth grade primarily drew pictures of male scientists (Barman 1999), and older students were less likely to draw female scientists than were younger students."
Another account from 2009 is typical of the gender analysis found in the interpretation of DAST drawings:
"Females more than males drew their scientist in a laboratory setting with symbols of knowledge such as books, charts, etc. It is also not surprising that males tended to draw their scientist as a male while females drew both male and female scientists. More females drew their scientists with eyeglasses than did the males. However more males drew their scientists as males with symbols of technology and mythical stereotypes. Overall gender analysis confirms a predominantly “manly” image of a scientist irrespective of the country from which the student hails from." (Narayan, 2009)
Stereotypes and negative attitudes to science
A direct connection between stereotypic images and negative attitudes to science is difficult to establish. In several studies over the next three decades (Smith & Erb, 1986; NSTA, 1992; NSTA, 1993; and Odell, Hewett, Bowman, & Boone, 1993) evidence indicated that negative stereotypes of science and scientists led to negative perceptions, which, in classrooms, led to negative attitudes toward science. At the same time, since scientific stereotypes are by no means exclusively negative, the lessons to be learned for science teaching are more complex. In any case, Chambers pointed out that most adults, even many scientists, utilize the standard indicators to convey graphically the concept “scientist”.