
 | ||
Domain coloring is a technique for visualizing functions of a complex variable. The term "domain coloring" was coined by Frank Farris, possibly around 1998. There were many earlier uses of color to visualize complex functions, typically mapping argument (phase) to hue. The technique of using continuous color to map points from domain to codomain or image plane was used in 1999 by George Abdo and Paul Godfrey and colored grids were used in graphics by Doug Arnold that he dates to 1997. A comprehensive introduction to phase plots (a special version of domain coloring) is given in Elias Wegert's textbook.
Contents
Insufficient dimensions
A real function f : ℝ → ℝ (for example f(x) = x2) can be graphed using two Cartesian coordinates on a plane.
A graph of a complex function g : ℂ → ℂ of one complex variable lives in a space with two complex dimensions. Since the complex plane itself is two-dimensional, a graph of a complex function is an object in four real dimensions. That makes complex functions difficult to visualize in a three-dimensional space. One way of depicting holomorphic functions is with a Riemann surface.
Visual encoding of complex numbers
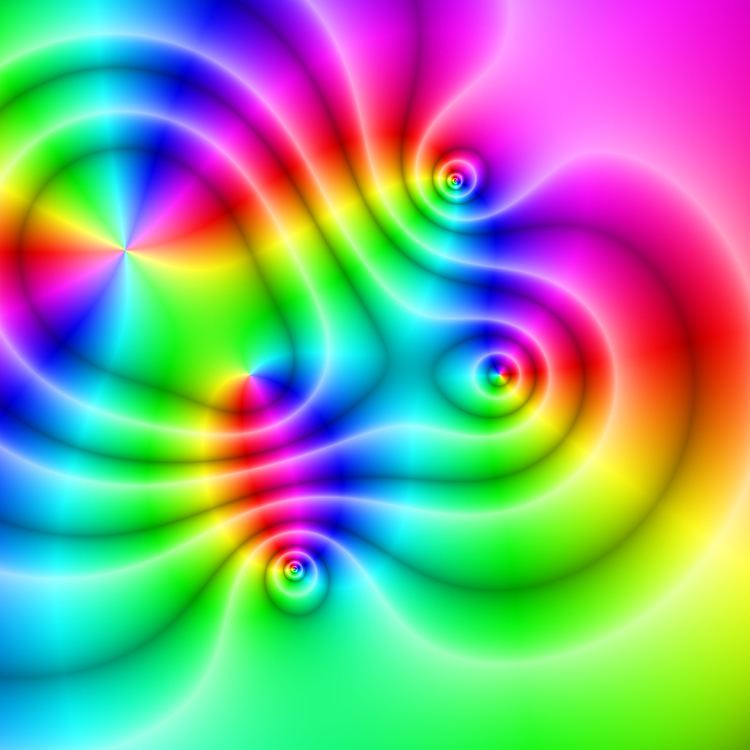
Given a complex number z = reiθ, the phase (also known as argument) θ can be represented by a hue, and the modulus r = | z | is represented by either intensity or variations in intensity. The arrangement of hues is arbitrary, but often it follows the color wheel. Sometimes the phase is represented by a specific gradient rather than hue.
Example
The following image depicts the sine function w = sin z from −2π to 2π on the real axis and −1.5 to 1.5 on the imaginary axis.