
 | ||
Denoising Algorithm based on Relevance network Topology (DART) is an unsupervised algorithm that estimates an activity score for a pathway in a gene expression matrix, following a denoising step. In DART, a weighted average is used where the weights reflect the degree of the nodes in the pruned network. The denoising step removes prior information that is inconsistent with a data set. This strategy substantially improves unsupervised predictions of pathway activity that are based on a prior model, which was learned from a different biological system or context.
Contents
Pre-existing methods such as gene set enrichment analysis method attempt to infer. However, it did not construct a structured list of genes. SPIA (Signaling Pathway Impact analysis) is a method that uses the phenotype information to evaluate the pathway activity between two phenotypes. However, it does not identify the pathway gene subset that could be used to differentiate individual samples. CORG is used to identify a relevant gene subset. It is a supervised method, which does not perform as well as DART in analyzing independent data set
Understanding molecular pathway activity is crucial for risk assessment, clinical diagnosis and treatment. Meta-analysis of complex genomic data is often associated with difficulties such as extracting useful information from big data, eliminating confounding factors and providing more sensible interpretation. Different approaches have been taken to highlight the identification of relevant pathway in order to provide better gene expression prediction.
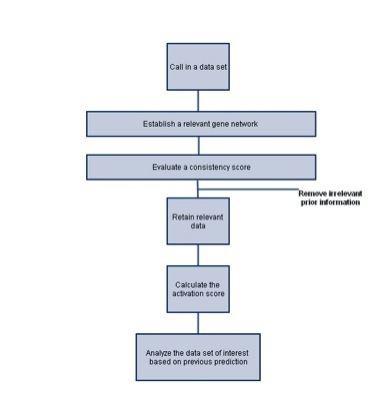
Strategy
- Build a network of all genes that are involved in the pathway
- Evaluate the consistency of the prior regulatory information
- Remove inconsistent prior information-the denoising step
- Estimate pathway activity
Pearson correlations were first computed between regulatory genes at the level of transcription and a gene expression data set. The correlation coefficient then underwent a Fisher's transform:
Where cij is the correlation coefficient between gene i and j, and where γij is the variable that under the null hypothesis, its mean is zero and standard deviation 1/√(n_s-3), where ns is the number of tumor samples. The threshold of p-value was set at 0.0001. Gene pairs with significant correlation will be considered relevant in the network. To predict the activity score in which genes that are nearby are also taken into consideration:
Where ki is the number of neighbors of gene i, zi is the normalized z-score and σi is a binary variable ( i.e 1 means upregulated upon activation and -1 means downregulated). This step is to estimate the activation level, in which sw AV is the activity score. A linear regression model was then applied to estimate the pathway activation levels. Thus, tij and pij denote the t-statistics and p-value associated with, whereas p<0.05 indicates a significance. To assess the consistency in a validation data set D, the performance measure Vij is denoted:
Where S is defined by
σij is the score that tells the directionality of a correlation, in which an opposite prediction will be panelized by given a value of -1. tij is the t-statistics of interpathway correlation. The performance measure Vij accounts for the significance of correlation between pathways, the direction of correlation, and the weights in the magnitude of the correlation. A two-tailed paired Wilcoxon test is performed to compare the distribution under hypothesis. Advantages and limitation: DART gives an improved performance and higher accuracy in inferring pathway activity from prior information of pathway databases. Pre-existed information and large database are needed in order for DART to run.In other words, DART requires well-established prior gene expression data to start with, and then it can proceed evaluation of consistency and denoise any irrelevant information.
Application
DART is an algorithm that is applicable and used successfully in Cancer Genomics. The DART algorithm has been shown to be a strong method for estimating the pathway activity and perturbation signature activity in breast and lung cancer gene expression data sets. Imaging traits such as mammography (Mammography is the process of using low-energy X-rays to examine the human breast tissue) plays an important role in cancer tumor diagnosis. Studies have shown that women with increased mammographic density have a higher risk of developing Breast cancer. Estrogen receptor alpha gene 1 encodes Estrogen Receptor-alpha, which is activated by estrogen. Polymorphisms in ESR1 are associated with breast cancer risk through differences in different level of breast density. DART successfully predicted an inverse correlation between ESR1 signaling and MMD. It can be used in simulated and real multidimensional cancer genomic data. It gives more reliable prediction about pathway activation, which would be helpful in association studies.