
 | ||
Demographics of Wales include the numbers in population, place of birth, age, ethnicity, religion, and number of marriages.
Contents
Historical population
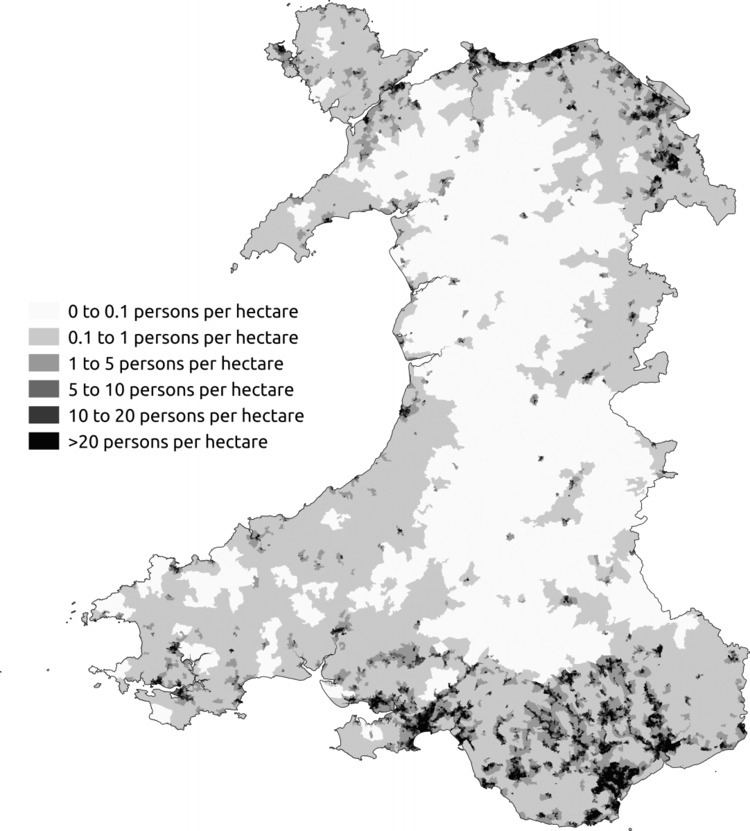
The population of Wales doubled from 587,000 in 1801 to 1,163,000 in 1851 and had reached 2,421,000 by 1911. Most of the increase came in the coal mining districts especially Glamorganshire, which grew from 71,000 in 1801 to 232,000 in 1851 and 1,122,000 in 1911. Part of this increase can be attributed to the demographic transition seen in most industrialising countries during the Industrial Revolution, as death-rates dropped and birth-rates remained steady. However, there was also a large-scale migration of people into Wales during the industrial revolution.
Current population
The resident population of Wales in 2011 increased by 5% since 2001 to 3,063,456, of whom 1,504,228 are men and 1,559,228 women, according to the 2011 census results. Wales accounted for 4.8% of the UK population in 2011.
The population in 1972 stood at 2.74 million and remained broadly static for the rest of the decade. However, in the early 1980s, the population fell due to net migration out of Wales. Since the 1980s, net migration has generally been positive, and has contributed more to population growth than natural change.
Place of birth
According to the 2011 census 2.2 million (73%) of the usual residents were born in Wales, a reduction of two percent since 2001. In 2001, 590,000 (20%) of the population of Wales was born in England. By 2011, the proportion of English-born citizens of Wales had increased by one percent to 21%. In 2011, 27% (837,000) of the total population of Wales were born outside Wales, and of these immigrants 636,000 (76%) were born in England.
Below are the 5 largest foreign-born groups in Wales according to 2014 ONS estimates.
Age
According to the 2011 census, some 563,000 of the population were aged 65 and over, an increase of 56,700 or one percent since 2001. As in 2001, six per cent (178,000) of the population in Wales were children under five, an increase of 11,300.
Source: 2011 Census: Usual resident population by five-year age group and sex, local authorities in the United Kingdom, Accessed 23 December 2012Ethnicity
According to the 2011 census, 2.2 million (73%) of usual residents of Wales were born there, two percent less than in 2001. The change can be attributed to both international and internal migration. In 2001, 590,000 (20%) of the population of Wales was born in England. In 2011, this had increased by one percent. Nearly 418,000 people identified themselves as Welsh in 2001.
The 2001 and 2011 census estimated the following ethnic groups:
Notes for table above
Source: Census 2001 Key Statistics - Urban area summary results for local authorities KS06 Ethnic group, Retrieved 18 June 2013 Source: Census 2011: Ethnic group, unitary authorities in Wales, Accessed 23 December 2012Religion
According to the 2011 census, there has been a 14 percent decrease since 2001, when 2.1 million (72% of usual residents) stated their religion as Christian. It is the only group to have experienced a decrease in numbers between 2001 and 2011 despite population growth. The second largest response group for this question in 2011 was no religion. This increased from 538,000 (19%) of residents in 2001 to 983,000 (32%) in 2011, a larger rise than in any region of England.
Language
The 2011 census collected information about English and Welsh language proficiency. In 2011, 2.9 million (97%) of residents, age three and over, spoke English or Welsh. In a further 18,000 households, at least one adult spoke English or Welsh. In 22,000 households, no resident spoke either language. There were 562,000 (19%) residents, over age three, proficient in at least speaking the Welsh language. This was a reduction of approximately 2 per cent compared to 2001, though the method of analysis differed between the two censuses. There was also a 2% increase in those, over three years of age, who had no Welsh language skills.
Source: 2011 Census: KS207WA Welsh language skills, unitary authorities in Wales, Accessed 23 December 2012The most common main languages spoken in Wales according to the 2011 census are shown below.
Marriage and civil partnership
In 2011 those who were married were still the largest marriage / civil partnership status group in Wales for residents aged 16 and over though since 2001 this group has decreased by 37,000 (over 5%). In contrast, single people (i.e. those who have never married or been part of a same sex partnership), have increased by 190,000 (6%) in the ten-year period. Civil partnerships, which were given legal status in 2005, appear for the first time in the census results. The number of widows, widowers and surviving partners is 20,000 lower than in 2001. The final groups, relating to separation and divorce / legal dissolution of civil partnerships, have both seen an increase in both numerical and relative terms since 2001.
Table key