
Population 2 062 294 (2012) Birth rate 11.4 per 1,000 (2012) Life expectancy 74.73 years (2010) | Growth rate 0.16% (2012) Death rate 9.8 per 1,000 (2012) | |
 | ||
Fertility rate 1.51 live births per woman (2012) | ||
This article is about the demographic features of the population of Republic of Macedonia, including population density, ethnicity, education level, health of the populous, economic status, religious affiliations and other aspects of the population.
Contents
- Map of Macedonia FYROM
- Total population
- European statistics estimates from health insurance funds and no census in sight
- Current natural increase
- Ethnic groups
- Languages
- Religions
- CIA World Factbook demographic statistics
- Age structure
- Sex ratio
- Infant mortality rate
- Life expectancy at birth
- Total fertility rate
- HIVAIDS
- Nationality
- References
Map of Macedonia (FYROM)
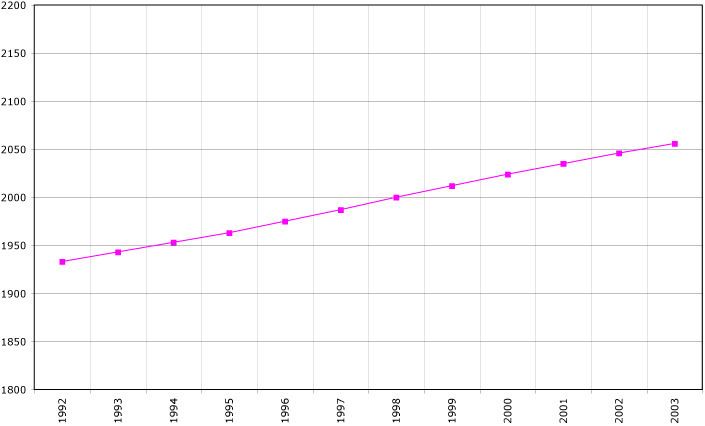
Total population
European statistics, estimates from health insurance funds and no census in sight
According to statistics from the European Union, the actual population has been reduced by at least 230.000 people who emigrated into European Union member states between 1998 and 2011. Further Albanian news sources estimated at October 2012 that the real population is closer to the sum of 1.744.237 people who are accounted within all of the health funds of the country. According to Bozhidar Dimitrov, the Bulgarian authorities have granted 87.000 to many of those emigrants a Bulgarian passport, as of 2012, because they declared to be ethnic Bulgarians. Since Bulgarias' entry in the European Union, and under pressure from fellow European Union members, Bulgaria imposed more stringent rules for the acquisition of a Bulgarian passport. The provisions of the Ohrid agreement to elevate any minority language if the minority in question is above 20% of the population of any municipality into a co-official language for that municipality has created friction within the government, and between officials of different political and ethnic interests, resulting to the indefinite postponement of the census which started at 2011. Since no funds have been allocated for a census in the state budget of 2014, there is no expectation for a census before 2015. As of early 2017 there is still no planned population census in near-term future.
Current natural increase
Ethnic groups
The process of industrialization and urbanization after the Second World War that caused the population growth to decrease involved the ethnic Macedonians to a greater extent than Muslims. Rates of increase were very high among rural Muslims: Turks and Torbesh (Macedonian Muslims) had rates 2.5 times those of the Macedonian majority, while Albanians and Roma had rates 3 times as high. This resulted in a significant demographic change as the Albanian population grew from 17% after the Second World War to 25% in the 1990s. This caused an increase in political tension and ultimately, after a brief conflict, forced the country to undertake reforms that decentralized the government. In 1994, Macedonian Slavs had a TFR of 2.07, while the TFR of others were - Albanian (4.10), Turkish (3.55), Roma (4.01), Serb (2.07), Vlachs (1.88) and Others (3.05). The TFR by religions was - Christian (2.17,with 2.20 for Catholics and 2.06 for Orthodox), Islam (4.02) and others (2.16).
However, it is unlikely that this high Muslim TFR has continued since then in Macedonia, as Balkan Muslim fertility elsewhere (Albania, Bosnia, and Kosovo) has dropped sharply toward the European average. A more recent survey pegs Muslim fertility in Macedonia at 1.7, versus 1.5 for non-Muslims.
In 2015, 23,075 children were born in Macedonia. The ethnic affiliation of these newborns was: 12,308 (53.35%) Macedonian; 7,604 (32.91%) Albanian; 1,098 (4.32%) Turkish; 1,271 (6.72%) Roma; 17 (0.07%) Vlach; 120 (0.52%) Serbian; 248 (1.07%) Bosniak; 408 (1.76%) other ethnic affiliation and unknown.
Languages
Religions
CIA World Factbook demographic statistics
The following demographic statistics are from the CIA World Factbook, unless otherwise indicated.