Harman Patil (Editor)

Demographics of the Northern Mariana Islands

Updated on
Edit
Like
Comment
Share on FacebookTweet on TwitterShare on LinkedInShare on Reddit
Demographics of the Northern Mariana Islands

This article is about the demographic features of the population of the Northern Mariana Islands, including population density, ethnicity, education level, health of the populace, economic status, religious affiliations and other aspects of the population.

Contents

CIA World Factbook demographic statistics

The following demographic statistics are from the CIA World Factbook
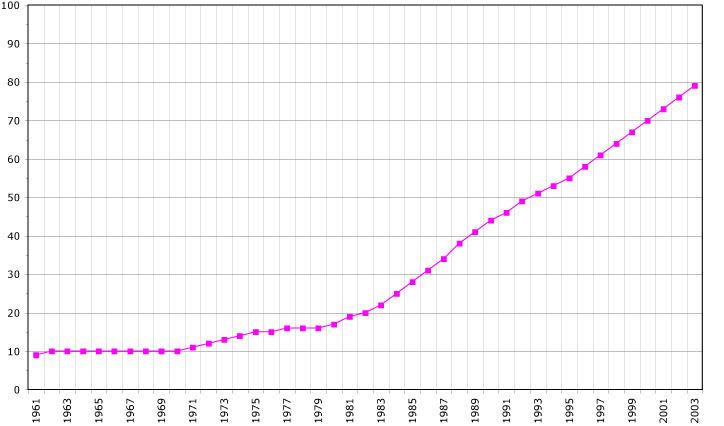
Population

  • 52,344
  • Age structure

  • 0–14 years: 25.6% (male 6,917/female 6,483)
  • 15–24 years: 14.39% (male 4,216/female 3,317)
  • 25–54 years: 44.3% (male 9,802/female 13,385)
  • 55–64 years: 10.76% (male 3,031/female 2,602)
  • 65 years and over: 4.95% (male 1,240/female 1,351) (2015 est.)
  • Population growth rate

  • 2.18%
  • Birth rate

  • 18.32 births/1,000 population
  • Death rate

  • 3.71 deaths/1,000 population
  • Net migration rate

  • 7.16 migrant(s)/1,000 population
  • Sex ratio

  • At birth: 1.06 male(s)/female
  • 0–14 years: 1.07 male(s)/female
  • 15–24 years: 1.27 male(s)/female
  • 25–54 years: 0.73 male(s)/female
  • 55–64 years: 1.17 male(s)/female
  • 65 years and over: 0.92 male(s)/female
  • Total population: 0.93 male(s)/female (2015 est.)
  • Infant mortality rate

  • Total: 5.4 deaths/1,000 live births
  • Male: 5.78 deaths/1,000 live births
  • Female: 5 deaths/1,000 live births (2015 est.)
  • Total fertility rate

  • 1.98 children born/woman
  • Nationality

  • noun: NA (US citizens)
  • adjective: NA
  • Ethnic groups

  • Asian 50% (includes Filipino 35.3%, Chinese 6.8%, Korean 4.2%, and other Asian 3.7%)
  • Native Hawaiian or other Pacific Islander 34.9% (includes Chamorro 23.9%, Carolinian 4.6%, and other Native Hawaiian or Pacific Islander 6.4%),
  • Other 2.5%, two or more ethnicities or races 12.7% (2010 est.)
  • Religions

  • Christian (Roman Catholic majority, although traditional beliefs and taboos may still be found)
  • Languages

  • Philippine languages 32.8%
  • Chamorro (official) 24.1%
  • English (official) 17%
  • Other Pacific island languages 10.1%
  • Chinese 6.8%
  • Other Asian languages 7.3%
  • Other 1.9%
  • References

    Demographics of the Northern Mariana Islands Wikipedia