
 | ||
This article is about the demographic features of the population of Zambia, including population density, ethnicity, education level, health of the populace, economic status, religious affiliations and others aspects of the population.
Contents
- Map of Zambia
- Ethnic groups
- 2000 census
- Population
- Vital statistics
- Fertility and Births
- CIA World Factbook demographic statistics
- Median age
- Sex ratio
- Life expectancy at birth
- HIVAIDS
- Nationality
- Religions
- Languages
- Literacy
- References
Map of Zambia
Ethnic groups
Zambia's population comprises more than 70 Bantu-speaking ethnic groups. Some ethnic groups are small, and only two have enough people to constitute at least 10% of the population. The majority of Zambians are subsistence farmers, but the country is also fairly urbanised, with 42% of the population being city residents. The predominant religion is a blend of traditional beliefs and Christianity.
Expatriates, mostly British or South African, as well as some white Zambian citizens (about 40,000), live mainly in Lusaka and in the Copperbelt in northern Zambia, where they are either employed in mines, financial and related activities or retired. Zambia also has a small but economically important Asian population, most of whom are Indians.
2000 census
African: 99.5% (includes Bemba, Tonga, Chewa, Lozi, Nsenga, Tumbuka, Ngoni, Lala, Kaonde, Lunda, and other African groups)
Other: 0.5% (includes Europeans, Asians, and Americans)
(2000 Census)
Population
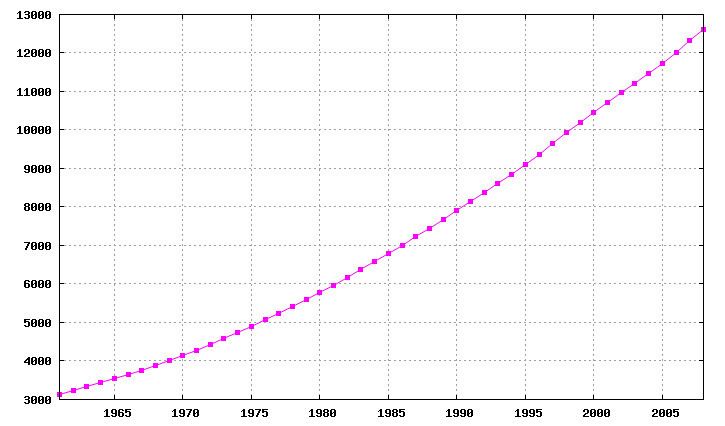
According to Population Pyramid of the World the total population of Zambia is 15 519 000 in 2015, compared to only 2 340 000 in 1950. The proportion of children below the age of 15 in 2010 was 46.4%, 50.6% was between 15 and 65 years of age, while 3.1% was 65 years or older.
Vital statistics
Registration of vital events is in Zambia not complete. The Population Departement of the United Nations prepared the following estimates.
Births and deaths
Fertility and Births
Total Fertility Rate (TFR) (Wanted TFR) and Crude Birth Rate (CBR) :
Fertility data as of 2013-2014 (DHS Program):
CIA World Factbook demographic statistics
The following demographic statistics are from the CIA World Factbook, unless otherwise indicated.
Median age
total: 17.2 yearsmale: 17.1 yearsfemale: 17.3 years (2010 est.)total: 16.46 yearsmale: 16.26 yearsfemale: 16.67 years (2005 est.)total: 16.5 yearsmale: 16.4 yearsfemale: 16.6 years (2002)Sex ratio
at birth: 1.03 male(s)/femaleunder 15 years: 1.01 male(s)/female15-64 years: 1.01 male(s)/female65 years and over: 0.68 male(s)/femaletotal population: 1 male(s)/female (2010 est.)Life expectancy at birth
total population: 52.03 yearsmale: 50.81 yearsfemale: 53.28 years (2010 est.)total population: 39.7 yearsmale: 39.43 yearsfemale: 39.98 years (2005 est.)total population:37.24 yearsmale:37.08 yearsfemale:37.41 years (2000 est.)HIV/AIDS
adult prevalence rate
15.2% (2007 est.)16.5% (2003 est.)21.5% (2001 est.)people living with HIV/AIDS
1.1 million (2007 est.)920,000 (2003 est.)1.2 million (2001 est.)deaths
56,000 (2007 est.)89,000 (2003 est.)120,000 (2001 est.)Nationality
noun:Zambian(s)adjective:ZambianReligions
Languages
English (official), major vernaculars - Bemba, Kaonde, Lozi, Lunda, Luvale, Nyanja, Tonga, and about 70 other indigenous languages (Ambo - Aushi - Bisa - Chikunda - Cishinga - Chokwe - Gova - Ila - Inamwanga - Iwa - Kabende - Kosa - Kunda - Kwandi - Kwandu - Kwangwa - Lala - Lamba - Lenje - Leya - Lima - Liyuwa - Luano - Lucazi - Lumbu - Lundwe - Lungu - Lunda - Makoma - Mambwe - Mashasha - Mashi - Mbowe - Mbukushu - Mbumi - Mbunda - Mbwela - Mukulu - Mulonga - Ndembu - Ng'umbo - Nkoya - Nsenga - Nyengo - Nyiha - Sala - Seba - Senga - Shanjo - Shila - Simaa - Soli - Subiya - Swaka - Tabwa - Tambo - Toka - Totela - Tumbuka - Twa - Unga - Wandya - Yombe)Literacy
definition: age 15 and over can read and write English
total population: 80.6%male: 86.8%female: 74.8% (2003 est.)total population: 78.2%male: 85.6%female: 71.3% (1995 est.)