
United Kingdom 35,000 Canada 19,500 Sweden 900 | United States 20,308 Australia 1,500 Italy 900 | |
 | ||
This article is about the demographic features of the population of Tanzania, including population density, ethnicity, education level, health of the populace, economic status, religious affiliations, and other aspects of the population.
Contents
- Map of Tanzania
- Population
- Structure of the population
- Vital statistics
- Fertility and Births Demographic and Health Surveys
- Total fertility rate in Tanzania
- CIA World Factbook demographic statistics
- Median age
- Sex ratio
- Life expectancy at birth
- HIVAIDS
- Languages
- Literacy
- Religions
- References
Map of Tanzania
The population distribution in Tanzania is extremely uneven. Most people live on the northern border or the eastern coast, with much of the remainder of the country being sparsely populated. Density varies from 12 per square kilometre (31/sq mi) in the Katavi Region to 3,133 per square kilometre (8,110/sq mi) in the Dar es Salaam Region. Approximately 70 percent of the population is rural, although this percentage has been declining since at least 1967. Dar es Salaam is the de facto capital and largest city. Dodoma, located in the centre of Tanzania, is the de jure capital, although action to move government buildings to Dodoma has stalled..
The population consists of about 125 ethnic groups. The Sukuma, Nyamwezi, Chagga, and Haya peoples have more than 1 million members each.
Over 100 different languages are spoken in Tanzania, making it the most linguistically diverse country in East Africa. Among the languages spoken in Tanzania are all four of Africa's language families: Bantu, Cushitic, Nilotic, and Khoisan. Swahili and English are Tanzania's official languages. Swahili belongs to the Bantu branch of the Niger-Congo family. The Sandawe people speak a language that may be related to the Khoe languages of Botswana and Namibia, while the language of the Hadzabe people, although it has similar click consonants, is arguably a language isolate. The language of the Iraqw people is Cushitic. Other languages are Indian languages and Portuguese (spoken by Goans and Mozambicans).
Although much of Zanzibar's native population came from the mainland, one group known as Shirazis traces its origins to the island's early Persian settlers. Non-Africans residing on the mainland and Zanzibar account for 1 percent of the total population. The Asian community, including Hindus, Sikhs, Shi'a and Sunni Muslims, Parsis, and Goans, has declined by 50 percent in the 2000s and early 2010s to 50,000 on the mainland and 4,000 on Zanzibar. An estimated 70,000 Arabs and 20,000 Europeans (90 percent of which are from the British diaspora) reside in Tanzania.
Based on 1999–2003 data, over 74,000 Tanzanian-born people were living in Organization for Economic Co-operation and Development countries, with 32,630 residing in the United Kingdom; 19,960 in Canada; 12,225 in the United States; 1,714 in Australia; 1,180 in the Netherlands; and 1,012 in Sweden.
Population
According to the 2012 census, the total population was 44,928,923 compared to 12,313,469 in 1967, resulting in an annual growth rate of 2.9 percent. The under 15 age group represented 44.1 percent of the population, with 35.5 percent being in the 15–35 age group, 52.2 percent being in the 15–64 age group, and 3.8 percent being older than 64.
According to the 2012 revision of the World Population Prospects, children below the age of 15 constituted 44.8 percent of the total population, with 52.0 percent aged 15–64 and 3.1 percent aged 65 or older.
Structure of the population
Structure of the population (01.07.2013) (Estimates) :
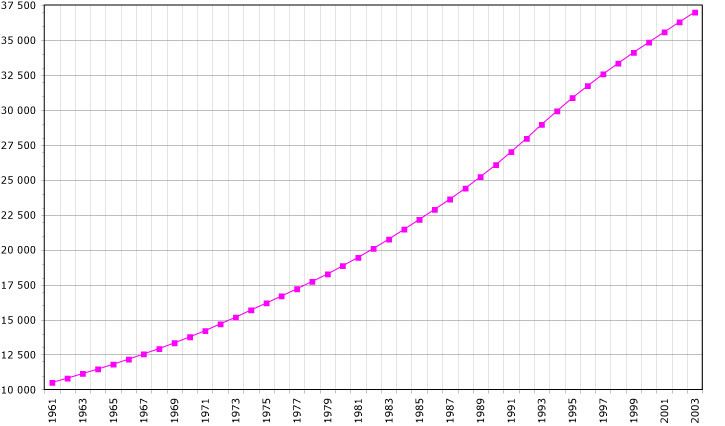
Vital statistics
The Tanzanian Demographic and Health Survey 2010 estimated that the infant mortality rate for 2005–10 was 51. Registration of other vital events in Tanzania is not complete. The Population Department of the United Nations prepared the following estimates.
Births and deaths
Population
Source:
Fertility and Births (Demographic and Health Surveys)
Total Fertility Rate (TFR) (Wanted Fertility Rate) and Crude Birth Rate (CBR):
Total fertility rate in Tanzania
Fertility rates are estimated by Surveys (TDHS) and Census in different times. TDHS surveys estimated these fertility rates :6.3 (1991–92), 5.8 (1996), 5.7 (2004–05), 5.4 (2010) and 2002 Census said 6.3
CIA World Factbook demographic statistics
The following demographic statistics are from the CIA World Factbook, unless otherwise indicated.
Population
Note: Estimates for this country explicitly take into account the effects of excess mortality due to AIDS; this can result in lower life expectancy, higher infant mortality, higher death rates, lower population growth rates, and changes in the distribution of population by age and sex than would otherwise be expected.
Median age
total: 17.3 years
male: 17.0 years
female: 17.6 years (2013 estimate)
Sex ratio
at birth: 1.03 male(s)/female
0-14 years: 1.02 male(s)/female
15–54 years: 1.00 male(s)/female
55-64 years: 0.75 male(s)/female
65 years and over: 0.76 male(s)/female
total population: 0.99 male(s)/female (2013 estimate)
Life expectancy at birth
total population: 60.76 years
male: 59.48 years
female: 62.09 years (2013 estimate)
HIV/AIDS
Age 15-49 HIV infection rates:
5.1 percent overall, with 6.2 percent of women and 3.8 percent of men being infected.People living with HIV/AIDS:
1.6 million (2011 estimate)Deaths:
86,000 (2009 estimate)Languages
Literacy
definition: age 15 and over can read and write Swahili, English, or Arabic
total population: 69.4%
male: 77.5%
female: 62.2% (2003 est.)
Religions
Most Tanzanians are nowadays Christians and Muslims. The numerical relationship between followers of the two religions is regarded as politically sensitive and questions about religious affiliation have not been included in census questionnaires since 1967.
For many years estimates have been repeated that about a third of the population each follows Islam, Christianity and traditional religions.
As there is likely no longer such a large percentage of traditional religionists, a range of competing estimates has been published giving one side or the other a large share or trying to show equal shares. These estimates range from 60% Christian : 36% Muslim in the Pew Report Islam and Christianity (2010) to 55% Muslim majority on the website Muslimpopulation.com.
Religion-related statistics for Tanzania have been regarded as notoriously biased and unreliable.
The remainder of the population are Hindus, Buddhists, animists, and unaffiliated. Most Christians are Roman Catholic, Lutheran or Seventh-Day Adventist, though a number of other Pentecostal churches, Anglicans, and Eastern Orthodox Christians are also represented in the country. Most Tanzanian Muslims are Sunni, though there are also populations of Ibadi, Shia, Ahamadiya, Bohora, and Sufi. Muslims are concentrated in coastal areas and in mainland areas along former caravan trade routes.