
 | ||
This article is about the demographics of the population of Saint Vincent and the Grenadines, including population density, ethnicity, religious affiliations and other aspects of the population.
Contents
- Map of St Vincent and the Grenadines
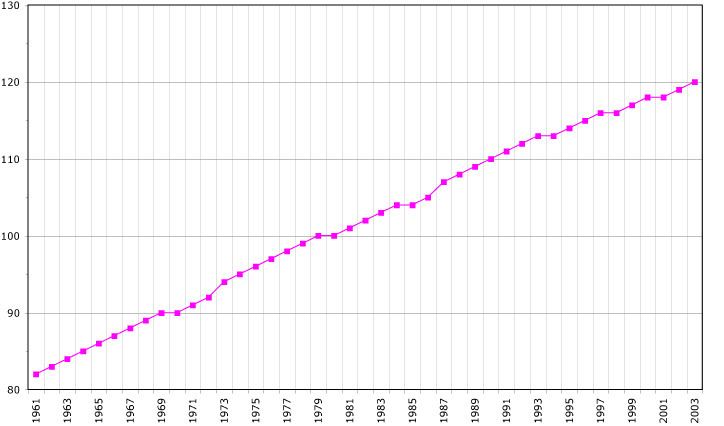
- Population
- Structure of the population
- Ethnic groups
- Language
- Religion
- References
Map of St Vincent and the Grenadines
Population
According to the 2001 population census Saint Vincent and the Grenadines has a population of 106,253, a decrease of 256 since the 1991 census. The population decrease of St. Vincent is caused by a high rate of emigration, as natural growth is positive. The estimated mid-year population of 2014 is 109,400 (medium fertility scenario of The 2012 Revision of the World Population Prospects).
Structure of the population
Structure of the population (01.07.2008) (Estimates) :
Ethnic groups
Saint Vincents's population is predominantly African/black (77,390 in 2001; 72.8% of the total population) or of mixed African-European descent (21,303; 20%). 1.4% of the population is East Indian (1,436 residents in 2001) and 1.4% white (608 Portuguese and 870 other white).
Saint Vincent & the Grenadines also has a small Black Carib population. During the past decades the Black Caribs increased from 3,347 at the 1991 census (3.1% of the population) to 3,818 at the 2001 census (3.6% of the population). Black Caribs are indigenous from the island of Saint Vincent, formed in the 18th century by the mixture between Carib Amerindians and black slaves. A part of their community (now known as Garifuna) was expelled from St. Vincent in 1797 and exported to the island of Roatán, Honduras, from where they migrated to the Caribbean coast of the mainland of Central America and spread as far as Belize and Nicaragua. While the Garifuna have retained their Carib language, the Black Caribs of Saint Vincent and the Grenadines speak Creole English.
The remaining 0.8% of the population includes Chinese and people from the Middle East.
Language
While the official language is English most Vincentians speak Vincentian Creole. English is used in education, government, religion, and other formal domains, while Creole (or "dialect" as it is referred to locally) is used in informal situations such as in the home and among friends.
Religion
Protestant 75% (Anglican 47%, Methodist 28%), Roman Catholic 13%, other (includes Hindu, Seventh-Day Adventist, other Protestant) 12%.
According to the 2001 census, 81.5% of the population of Saint Vincent and the Grenadines is considered Christian, 6.7% has another religion and 8.8% has no religion or did not state a religion (1.5%).
Anglicanism constitutes the largest religion, with 47.8% of the population. Methodists are the second largest group (28%). The next largest group are Roman Catholics (13% of the population), followed by other religions including Hindu, Seventh-Day Adventist, other Protestant (12% of the population)
Between 1991 and 2001 the number of Anglicans, Brethren, Methodists and Roman Catholics decreased, while the number of Pentecostals, Evangelicals and Seventh-day Adventists increased.