
 | ||
The demographics of Poland constitute all demographic features of the population of Poland, including population density, ethnicity, education level, health of the populace, economic status, religious affiliations and other aspects of the population.
Contents
- Map of Poland
- Historical population
- At present
- Current vital statistics
- Nationalities
- Largest metropolitan and urban areas
- Demographic statistics
- Religions
- Languages
- References
Map of Poland
According to estimates produced by the Polish Central Statistical Office (GUS), at the end of 2007 Poland had a population of 37,115,000, which translates into an average population density of 122 people/km2 (urban 1105 per 1 km2, rural 50 per 1 km2). 61.5% of the Polish population lives in urban areas, a number which is slowly diminishing. Poland is the 33rd most populous country in the world (9th in Europe, with 5.4% of the European population). Total population of Poland is almost stagnant (population growth was 0.08%). Average life expectancy was 70.5 for men and 78.9 for women. In 2009, it was expected to be 73.1 for men and 79.5 for women. Population distribution is uneven. Ethnically, Poland is a very homogeneous country, with 96.7% of population being Polish.
A number of censuses have assessed this data, including a national census in 2002, and a survey by the Helsinki Foundation for Human Rights (HFHR), which confirmed there are numerous autochthonous ethnic groups in Poland. Estimates by INTEREG and Eurominority present a similar demographic picture of Poland but they provide estimates only for the most numerous of these ethnic groups.
Poland is aging rapidly. In 1950, the median age was 25.8: half of the Polish population was younger, half older. Today it is 38.2. If current trends continue, it will be 51 by 2050. As the population is aging, it has also started to decline mainly due to low birth rates and continued emigration which is impacting the economy. The number of children born in Polish families (TFR of 1.31, down from 2 in 1990) is one of the lowest in Eastern Europe.
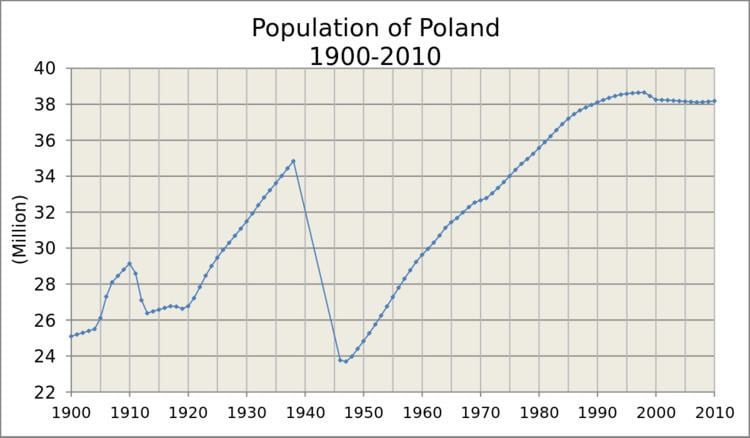
Historical population
For many centuries, until the end of World War II, the Polish population was composed of many significant ethnic minorities. The population of Poland decreased due to the losses sustained during the Holocaust, and became one of the most ethnically homogeneous in Europe ( next to populations of Slovakia and Czech Republik ) as a result of radically altered borders after the war. The subsequent repatriations were accompanied by two waves of forced migrations ordered by the Soviet and Polish communist authorities, including the transfers of sizable Polish population from the prewar territories of Eastern Poland, which today are divided between Lithuania, Belarus and Ukraine, the transfer of ethnic Ukrainians back to USSR, and the Germans to Germany from lands ceded to Poland after the Yalta Conference.
At present
According to GUS, about 38,325,000 people live in Poland, however, the same report states that the number of residents living in the country all the time is approximately 37,200,000; with 1,125,000 people living abroad for 6–7 months or more. It means that the permanent population may be correspondingly smaller.
A recent large migration of Poles took place following Poland's accession to the European Union and opening of the EU's labor market; with an approximate number of 2 million primarily young Poles taking up jobs abroad.
(p) = preliminar
Current vital statistics
Number of births from January to November 2015 = 343 000 (9,7‰)
Number of births from January to November 2016 = 353 400 (10,0‰)
Number of deaths from January to November 2015 = 360 300 (10,2‰)
Number of deaths from January to November 2016 = 353 300 (10,0‰)
Natural increase from January to November 2015 = -17 300 (-0,5‰)
Natural increase from January to November 2016 = 100 (0,0‰)
Nationalities
In 2011, the vast majority of Poland's population (97.10%) identified as having either exclusively or partly Polish nationality, with 98.19% stating Polish as the language spoken at home. Minority groups within the country included individuals identifying as Silesian (847,000), Kashubian (233,000), German (148,000), and Ukrainian (51,000). However, these figures do not account for the estimated 1 million Ukrainian migrant workers who had arrived in Poland by 2015, as reported by the National Bank of Poland.
Largest metropolitan and urban areas
Demographic statistics
Age structure
0–14 years: 14.8% (male 2,931,732/female 2,769,021)15–64 years: 71.7% (male 13,725,939/female 13,863,103)65 years and over: 13.5% (male 1,971,763/female 3,202,131) (2010 est.)0-14 years: 14.7% (male 2,910,324/female 2,748,546)15-64 years: 71.6% (male 13,698,363/female 13,834,779)65 years and over: 13.7% (male 2,004,550/female 3,245,026) (2011 est.)Median age
total: 38.5 yearsmale: 36.8 yearsfemale: 40.3 years (2011 est.)Sex ratio
at birth: 1.06 male(s)/femaleunder 15 years: 1.06 male(s)/female15-64 years: 0.99 male(s)/female65 years and over: 0.62 male(s)/femaletotal population: 0.94 male(s)/female (2012 est.)Infant mortality rate
total: 6.42 deaths/1,000 live birthsmale: 7.12 deaths/1,000 live birthsfemale: 5.67 deaths/1,000 live births (2012 est.)Life expectancy at birth
total population: 75.85 yearsmale: 71.88 yearsfemale: 80.06 years (2010 est.)total population: 76.25 yearsmale: 72.31 yearsfemale: 80.43 years (2012 est.)