
 | ||
This article is about the demographic features of the population of Norway, including population density, ethnicity, education level, health of the populace, economic status, religious affiliations and other aspects of the population.
Contents
- Map of Norway
- Total population
- Population growth rate in 2012
- Vital statistics since 1900
- Current natural increase
- Total fertility rate
- Ethnicity
- Immigration
- Religion
- Y chromosome DNA
- Mitochondrial DNA
- CIA World Factbook demographic statistics
- Population
- Population comparative
- Age structure
- Historical age structure
- Median age
- Population growth rate comparative
- Urbanization
- Sex ratio
- Infant mortality rate
- Life expectancy at birth
- Official languages
- References
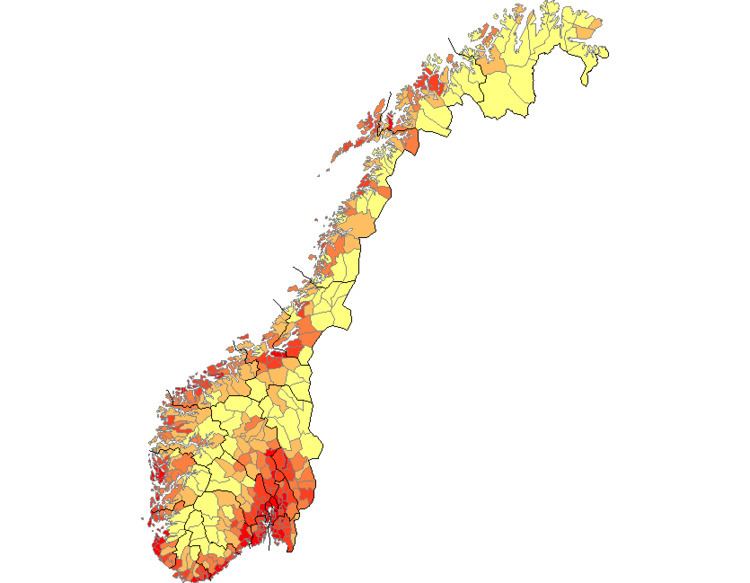
Map of Norway
Total population
The total population of Norway on 1 January 2013 was 5,051,275. Statistics Norway estimated that the 5,000,000 milestone was reached 19 March 2012.
Population growth rate in 2012
Vital statistics since 1900
Data according to Statistics Norway, which collects the official statistics for Norway.
Current natural increase
Total fertility rate
Norway has one of the highest fertility rates in Europe. Norwegian women had as many as 4.6 children on average in the late 19th century; more than ten children was not unusual. Later, it has decreased dramatically from 2.7 in the late 1960s to 1.6 in the early 1980s, however it has increased to 1.73 as of 2015.
TFR for Norwegian residents by country of birth in 2004: Norway (1.8), Somalia (4.4), Iraq (4.3), Morocco (3.6), Pakistan (3.2), Turkey (2.3), Iran (1.6), Vietnam (2.0), Sri Lanka (2.7), India (1.8), and Bosnia and Herzegovina (1.7). [3]
Ethnicity
Ethnically, the residents of Norway are predominantly ethnic Norwegians who are of North Germanic / Nordic descent, although there are communities of the Scandinavian native people Sami who settled the area around 8,000 years ago, probably from continental Europe through the Norwegian coast and through Finland along the inland glaciers. The national minorities of Norway include Scandinavian Romani, Roma, Jews, and Kvener, as well as a small Finnish community.
In the last decades, Norway has become home to increasing numbers of immigrants, foreign workers, and asylum-seekers from various parts of the world. Norway had a steady influx of immigrants from South Asia (mostly Pakistanis and Sri Lankans), East Asia (mainly the Chinese), and Southeast Asia (e.g. Filipinos), Eastern Europe (e.g. Russians and Poles), Southern Europe (Greeks, Albanians and people from former Yugoslavia etc.), and Middle East countries (especially Iraqis and Palestinians), as well as Somalis, Turks, Moroccans, and some Latin Americans. After ten Eastern European and Baltic countries joined the EU in 2004, there has also been a substantial influx of people from Poland, Estonia, Latvia and Lithuania.
Immigrants constituted 13% of the population at the start of 2015, and an additional 2,6% were born in Norway by immigrant parents (up from 8,3% and 1,5% in 2006). The same year, 19% of births in Norway were to immigrant parents. In 2006, non-Western immigrants constituted 75% of the total number of immigrants. They contribute much of the population growth. Among people of African descent in Oslo, almost 60% are younger than 30, compared to 20% of those of North American background.
Of these 660 000 immigrants and their descendants:
In 2012, of the total 660 000 with immigrant background, 407,262 had Norwegian citizenship (62.2 percent).
Immigrants were represented in all Norwegian municipalities. The cities or municipalities with the highest share of immigrants in 2012 was Oslo (26 percent) and Drammen (18 percent). The share in Stavanger was 16%. According to Reuters, Oslo is the "fastest growing city in Europe because of increased immigration". In recent years, immigration has accounted for most of Norway's population growth.
Immigration
As of 2012, an official study shows that the quotient of the total population that is either born outside Norway, or has one or two parents born abroad, or has one or more grandparents born abroad is 1,100,000 to 5,017,500 (which equals 21.9%).
About a half million of these, however, identify as ethnic Norwegians who may have, for example, one Swedish grandparent. As of 2012, an official study shows that 86.2% of the total population are Ethnic Norwegians and more than 660,000 individuals (.%) are migrants and their descendants (110,000 second generation migrants born in Norway).
Of these 660,000 immigrants and their descendants:
Religion
The Lutheran Church of Norway is the former state church and the vast majority remain at least nominal members. Other religions do, however, enjoy religious freedom and have prospered with immigration in recent years, particularly Islam and Roman Catholicism. Saint Olaf is the patron saint of Norway. He is regarded by some as the eternal king and has a reputation and place in history unchallenged by any other Norwegian King for the last 1000 years.
Y-chromosome DNA
Y-Chromosome DNA (Y-DNA) represents the male lineage, The Norwegian Y-chromosome pool may be summarized as follows where haplogroups R1 & I comprise generally more than 85% of the total chromosomes.
Mitochondrial DNA
Mitochondrial DNA mtDNA represents the female lineage, Haplogroup H represent about 40% of the Norwegian mitochondrial DNA lineages
CIA World Factbook demographic statistics
The following demographic statistics are from the CIA World Factbook, unless otherwise indicated.
Population
1860: 1,583,525
1910: 2,376,952
1960: 3,570,554
2010: 4,858,199
2012: 5,000,000
2060?: 7,032,687
Population - comparative
Slightly larger than British Columbia, but slightly smaller than Singapore and Eritrea.
Age structure
(2011 est.)
0–14 years: 18.8% (male 472,060; female 449,649)
15–64 years: 66.2% (male 1,662,852; female 1,593,501)
65 years and over: 15.0% (male 325,937; female 416,306)
Historical age structure
(1860 est.)
0–14 years: 35.9% (male 288,510; female 280,249)
15–64 years: 58.0% (male 446,391; female 472,405)
65 years and over: 6.1% (male 42,130; female 53,840)
(1910 est.)
0–14 years: 35.0% (male 423,253; female 408,204)
15–64 years: 57.3% (male 640,835; female 722,443)
65 years and over: 7.7% (male 82,312; female 99,905)
(1960 est.)
0–14 years: 26.0% (male 476,748; female 452,559)
15–64 years: 63.0% (male 1,125,525; female 1,123,206)
65 years and over: 11.0% (male 175,485; female 214,184)
(2010 est.)
0–14 years: 18.9% (male 470,253; female 447,472)
15–64 years: 66.2% (male 1,641,821; female 1,575,980)
65 years and over: 14.9% (male 314,678; female 407,995)
(2060 est.)
0–14 years: 17.4% (male 628,729; female 596,683)
15–64 years: 58.7% (male 2,114,792; female 2,016,030)
65 years and over: 23.9% (male 805,111; female 871,342)
Median age
(2010 est.)
total: 39.7 years
male: 38.8 years
female: 40.5 years
Population growth rate - comparative
Slightly higher than Arkansas (USA) and Samoa, but slightly lower than Liechtenstein and New Zealand.
Urbanization
(2011 est.)
urban population: 79.2% of total population (2005-10 est.)
rate of urbanization: 0.7% annual rate of change
Sex ratio
(2004 est.)
at birth: 1.05 male(s)/female
under 15 years: 1.05 male(s)/female
15–64 years: 1.04 male(s)/female
65 years and over: 0.72 male(s)/female
total population: 0.98 male(s)/female
Infant mortality rate
(2005)
total: 3.1 deaths/1,000 live births
male: 3.3 deaths/1,000 live births
female: 2.9 deaths/1,000 live births
Life expectancy at birth
(2010)
total population: 81.04 years
male: 78.85 years
female: 83.15 years
Official languages
Norwegian (the written standards Bokmål and Nynorsk).
Five Uralic languages – Finnish, South Sami, Lule Sami, North Sami and Kven – are additional official languages of some municipalities.