Harman Patil (Editor)

Demographic history of the Republic of Macedonia

Updated on
Edit
Like
Comment
Share on FacebookTweet on TwitterShare on LinkedInShare on Reddit
Demographic history of the Republic of Macedonia

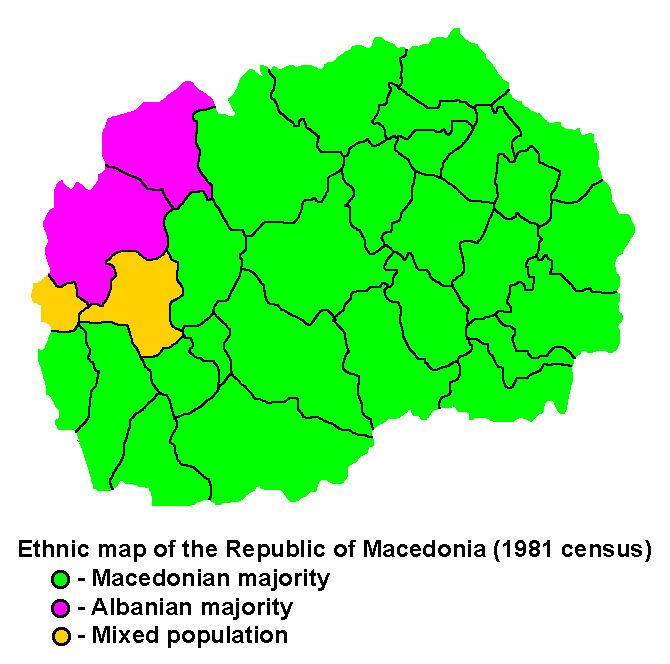
This article presents the Demographic history of the Republic of Macedonia through census results since 1948.

Contents

1948 census

  • TOTAL = 1,152,986
  • Macedonians = 789,603 (68.5%)
  • Albanians = 197,603 (17.1%)
  • Turks = 95,940 (8.3%)
  • Serbs = 29,721 (2.6%)
  • Romani = 19,500 (1.7%)
  • Aromanians = 9,511 (0.8%)
  • Montenegrins = 2,348 (0.2%)
  • Croats = 2,090
  • Muslims = 1,560
  • Others = 5,324 (0.46%)
  • 1953 census

  • TOTAL = 1,394,514
  • Macedonians = 860,699 (66%)
  • Albanians = 162,000 (12.4%)
  • Turks = 203,928 (15.6%)
  • Romani = 20,462 (1.6%)
  • Serbs = 35,112 (2.7%)
  • Croats = 2,771
  • Montenegrins = 2,526 (0.18%)
  • Muslims = 1,591
  • Others = 56,981 (1.07%)
  • 1961 census

  • TOTAL = 1,406,003
  • Macedonians = 900,685 (71.2%)
  • Albanians = 183,108 (13%)
  • Turks = 131,481 (9.4%)
  • Serbs = 42,728 (2.7%)
  • Romani = 20,606 (1.5%)
  • Croats = 3,801
  • Montenegrins = 3,414 (0.24%)
  • Yugoslavs = 1,260
  • Muslims = 3,002
  • Slovenes = 1,147
  • Others = 90,549 (1.03%)
  • 1971 census

  • TOTAL = 1,647,308
  • Macedonians = 1,142,375 (69.3%)
  • Albanians = 279,871 (17%)
  • Turks = 108,552 (6.6%)
  • Romani = 24,505 (1.5%)
  • Yugoslavs = 3,652 (0.24%)
  • Serbs = 46,465 (2.85%)
  • Aromanians = 7,000 (0.42%)
  • Croats = 3,882
  • Montenegrins = 3,246 (0.19%)
  • Muslims = 1,248
  • Others = 34,005 (1.55%)
  • 1981 census

  • TOTAL = 1,909,146
  • Macedonians = 1,279,323 (67%)
  • Albanians = 377,208 (19.8%)
  • Turks = 86,591 (4.5%)
  • Romani = 43,125 (2.3%)
  • Aromanians = 6,384 (0.3%)
  • Serbs = 44,613 (2.3%)
  • Muslims = 39,555 (2.2%)
  • Yugoslavs = 14,240
  • Croats = 3,349
  • Montenegrins = 3,940 (0.21%)
  • Others = 10,818 (0.56%)
  • 1991 census

  • TOTAL = 2,033,964
  • Macedonians = 1,328,187 (65.3%)
  • Albanians = 441,987 (21.73%)
  • Turks = 77,080 (3.79%)
  • Romani = 52,103 (2.56%)
  • Aromanians = 7,764 (0.38%)
  • Serbs = 42,755 (2.1%)
  • Muslims = 31,356 (1.54%)
  • Greeks = 474 (0.02%)
  • Bulgarians = 1,370 (0.07%)
  • Others = 50,888 (2.6%)
  • 1994 census

  • TOTAL = 1,936,877
  • Macedonians = 1,288,330 (66.5%)
  • Albanians = 441,104 (22.86%)
  • Turks = 77,252 (4%)
  • Romani = 43,732 (2.25%)
  • Aromanians = 8,467(0.44%)
  • Serbs = 39,620 (2.04%)
  • Others = 34,960 (1.8%)
  • 2002 census

  • TOTAL = 2,022,547
  • Macedonians: 1,297,981 (64.17%)
  • Albanians: 509,083 (25.17%)
  • Turks: 77,959 (3.85%)
  • Romani: 53,879 (2.66%)
  • Serbs: 35,939 (1.78%)
  • Bosniaks 17,018 (0.84%)
  • Aromanians: 9,695 (0.479%)
  • Egyptians: 3,713 (0.184%)
  • Croats: 2,686 (0.133%)
  • Muslims: 2,553 (0.13%)
  • Montenegrins: 2,003 (0.1%)
  • Bulgarians: 1,418 (0.073%)
  • Greeks: 422 (0.021%)
  • Russians: 368 (0.018%)
  • Slovenes: 365
  • Poles: 162
  • Ukrainians: 136
  • Hungarians: 129
  • Germans: 88
  • Czechs: 60
  • Slovaks: 60
  • Jews: 53
  • Italians: 46
  • Austrians: 35
  • Rusyns: 24
  • Regionally affiliated: 829
  • Non-declared: 404
  • Others: 5,332 (0.264%)
  • References

    Demographic history of the Republic of Macedonia Wikipedia