
 | ||
DNA patterns are graphs of DNA or RNA sequences. Various functional structures such as promoters and genes, or larger structures like bacterial or viral genomes, can be analyzed using DNA patterns.
Contents
Method
The technique was described in 2012 by Paul Gagniuc and Constantin Ionescu-Tirgoviste. They adapted algorithms from cryptography and optical character recognition to make their graphs. To graph a DNA pattern, two values, kappa index of coincidence and the total percentage of cytosine plus guanine (C + G)% are calculated from a sliding window which is "circulated" over the DNA sequence. The kappa index of coincidence measures the degree of organization or randomness of a sequence.
The analysis of such two-dimensional patterns can be performed by considering their shape and density (using optical character recognition algorithms) and the trend-line of the points. Inside a pattern, long homopolymeric tracts will be plotted in the upper part of the pattern (relative to the nucleotide frequency of the entire sequence) and tandem short tracts will be plotted in the middle of the pattern. As the homopolymeric tracts become shorter and shorter (up to di- or tri- nucleotide formations), the kappa value decreases and the point on the pattern will be placed also in the middle, but lower on the Y-axis. All the values generated by the same repetitive sequences will be positioned in exactly the same point on the pattern (total points inside the pattern = promoter length - sliding window length).
Current uses and discoveries
By using the DNA pattern method, two major observations have been made regarding gene promoters:
1) The total number of types of gene promoters, namely 10 possible classes of gene promoters in eukaryote.
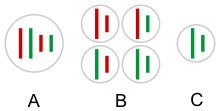
2) Structural properties of gene promoters show more than two phenotypes of diabetes. Here, the distribution of DNA patterns shows a clustering of gene promoters by phenotype (Figure 2).
Example
Human INS (insulin) gene promoter ranging from -499b to 100b, relative to the TSS (transcription start site). >gi|224514737|ref|NT_009237.18|:c2122939-2121009 H.sapiens INS gene region, 500 bases upstream of TSS:
GGTGTGGGGACAGGGGTGTGGGGACAGGGGTCTGGGGACAGGGGTGTGGG GACAGGGGTCCTGGGGACAGGGGTGTGGGGATAGGGGTGTGGGGACAGGG GTGTGGGGACAGGGGTGTGGGGACAGGGGTCTGGGGACAGCAGCGCAAAG AGCCCCGCCCTGCAGCCTCCAGCTCTCCTGGTCTAATGTGGAAAGTGGCC CAGGTGAGGGCTTTGCTCTCCTGGAGACATTTGCCCCCAGCTGTGAGCAG GGACAGGTCTGGCCACCGGGCCCCTGGTTAAGACTCTAATGACCCGCTGG TCCTGAGGAAGAGGTGCTGACGACCAAGGAGATCTTCCCACAGACCCAGC ACCAGGGAAATGGTCCGGAAATTGCAGCCTCAGCCCCCAGCCATCTGCCG ACCCCCCCACCCCAGGCCCTAATGGGCCAGGCGGCAGGGGTTGAGAGGTA GGGGAGATGGGCTCTGAGACTATAAAGCCAGCGGGGGCCCAGCAGCCCTCGagniuc Java Script implementation
The implementation below produces the DNA pattern of the insulin gene promoter (Figure 1):
Note: A blank 333 x 309 PNG image must be present in the same folder as the script/html file.