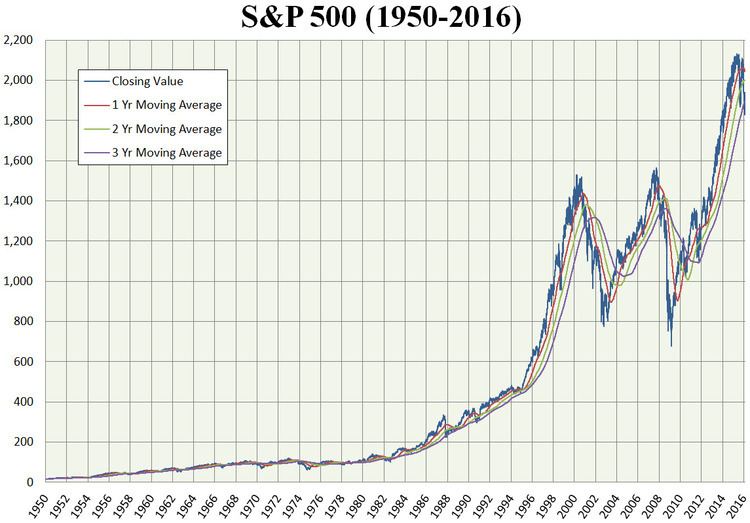
This article is a summary of the closing milestones of the S&P 500 Index, a United States stock market index. Since opening at 16.66 on January 3, 1950, the S&P 500 has substantially increased despite several periods of decline.
Standard & Poor's, initially known as the Standard Statistics Company, created its first stock market index in 1923. It consisted of 233 different stocks and was computed on a weekly basis. Three years later, it developed a 90 component composite price index that was computed on a daily basis; that was expanded over the years. On March 4, 1957, the Standard & Poor's 500 (.INX) (.SPX) was introduced.
Milestone highs and lows
June 4, 1968: S&P 500 closes above 100 for the first time.October 19, 1987: S&P 500 registers its largest daily percentage loss, falling 20.47 percent. The one-day crash, known as "Black Monday," was blamed on program trading and those using a hedging strategy known as portfolio insurance. Despite the losses, the S&P 500 still closed positive for the year.March 24, 1995: The S&P 500 index closes above 500 for the first time. In exactly five years time, the S&P 500 tripled its value, and reached its peak prior to the dot-com bubble.February 2, 1998: S&P 500 closes above 1,000 for the first time.March 15, 1999: The S&P 500 closed above 1,300 for the first time. On the next day, the more commonly followed Dow Jones Industrial Average traded above 10,000 points for the first time.March 24, 2000: The S&P 500 index reaches an all-time intraday high of 1,552.87 during the dot-com bubble.October 9, 2007: Index closes at a record high of 1,565.15, the highest close prior to the 2008 financial crisis.October 11, 2007: S&P 500 hits an intraday record high of 1,576.09.October 13, 2008: S&P 500 marks its best daily percentage gain, rising 11.58 percent. It also registers its largest single-day point increase of 104.13 points.December 31, 2008: For the year, S&P 500 falls 38.49 percent, its worst yearly percentage loss. In September 2008, Lehman Brothers collapsed as the financial crisis spread.March 9, 2009: S&P 500 closes at 676.53, its closing low after the onset of the 2008 financial crisis and the bankruptcy of Lehman Brothers.March 28, 2013: S&P 500 ends at 1,569.19, surpassing its previous record closing high set in 2007.April 10, 2013: S&P 500 hits new all-time intraday record high at 1,589.07, surpassing the previous record of 1,576.09 set during trading on October 11, 2007.May 3, 2013: S&P 500 closes above 1,600 for the first time, finishing at 1,614.42 after a much better-than-expected April U.S. non-farm payrolls report. The index also hit an all-time intraday high of 1,618.46.August 1, 2013: S&P 500 closes above 1,700 for the first time, finishing at 1,706.87, as well as reaching an all-time intraday high of 1,707.85.November 22, 2013: S&P 500 closes above 1,800 for the first time, finishing at 1,804.76 points.May 23, 2014: S&P 500 closes above 1,900 for the first time, finishing at 1,900.53 points.August 26, 2014: S&P 500 closes above 2,000 for the first time, finishing at 2,000.02 points.February 17, 2015: S&P 500 closes above 2,100 for the first time, finishing at 2,100.34 points.November 22, 2016: S&P 500 closes above 2,200 for the first time, finishing at 2,202.94 points.February 9, 2017: S&P 500 closes above 2,300 for the first time, finishing at 2,307.87 points.The following is a list of the milestone closing levels of the S&P 500. 1-point increments are used up to the 20-point level; 2 to 50; 5 to 100; 10 to 500; 20 to 1,000; 50 to 3,000; and 100-point increments thereafter. Additional milestones may be used if necessary.