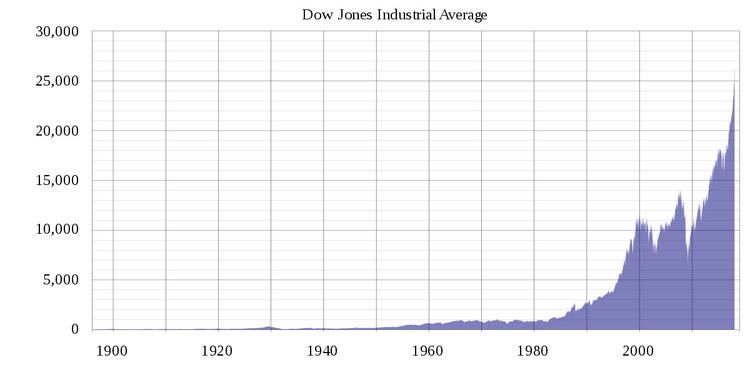
This article is a summary of the closing milestones of the Dow Jones Industrial Average, a United States stock market index. Since first closing at 62.76 on February 16, 1885, the Dow Jones Industrial Average has increased, despite several periods of decline.
Milestone highs and lows
Like most other stock market indexes, the Dow undergoes periods of general increase and general declines or stagnation. A bull market is a term denoting a period of price increases, while a bear market denotes a period of declines. Wall Street generally considers a bear market in session when multiple broad market indexes have a downturn of 20% or more in value lasting for at least 2 months.
There are two types of bull markets. A secular bull market is a period in which the stock market index is continually reaching all-time highs with only brief periods of correction, as during the 1990s, and can last upwards of 15 years. A cyclical bull market is a period in which the stock market index is reaching 52-week or multi-year highs and may briefly peak at all-time highs before a rapid decline, as in the early 1970s. It usually occurs within relatively longer bear markets and lasts about three years.
The following are the secular bull and bear markets experienced by the Dow since its inception:
1885–1890: Bull market. From its first close of 62.76 on February 16, 1885, the Dow rises steadily for five years, until reaching a peak of 78.38 on June 4, 1890. This record would stand for nearly 15 years, until the Dow closed at 79.27 on March 24, 1905.1890–1896: Bear market. The Dow plunges over 63% over the next six years, to set an all-time low of 28.48, on August 8, 1896.1896–1906: Bull market. After setting an all-time low during the summer of 1896, the Dow quickly erases these losses, and eventually reaches a peak of 103.00 on January 19, 1906.1906–1915: Bear market. The Dow loses 48.5% of its value over the next 22 months, before reaching a low of 53 on November 15, 1907. From 1906 to 1915, the Dow remains stuck trading between 53 and 103. The index reaches a secondary low of 53.17 on December 24, 1914.1915–1919: Bull market. After hitting a seven-year low in late 1914, the Dow rises 125% over the next five years, reaching a new high of 119.62 on November 3, 1919.1919–1921: Bear market. The Dow loses 46.6% of its value in just over 21 months, before reaching a low of 63.90 on August 24, 1921.1921–1929: Bull market. Over the next eight years, the Dow increases nearly 500%, and eventually grows to a closing high of 381.17 (theoretical intra-day high of 386.10) on September 3, 1929.1929–1949: Bear market. The stock market crash of 1929 precedes the Great Depression. The Dow plunges to 41.22 (theoretical intra-day low of 40.56) on July 8, 1932, thus erasing 33 years of gains, in just under three years. Although cyclical bull markets occur in the 1930s and 1940s, the index takes 22 years to surpass its previous highs.1949–1966: Bull market. The Dow posts impressive growth in the booming economy following the Second World War. Starting from 161.60 in June 1949, when P/E ratios reach multi-decade lows, the index ends just five points below 1,000 on February 9, 1966. The inflation-adjusted high set on December 31, 1965 would not be surpassed for nearly 30 years, until the Dow's first close above 4,700 on July 7, 1995.1966–1982: Bear market. Traders deal with a stagnant economy in an inflationary monetary environment. The Dow enters two long downturns in 1970 and 1974; during the latter, it falls nearly 45% to the bottom of a 20-year range.1982–2000: Bull market. The Dow experiences its most spectacular rise in history. From a meager 777 on August 12, 1982, the index grows more than 1,500% to close at 11,722.98 by January 14, 2000, without any major reversals except for a brief but severe downturn in 1987, which includes the largest daily percentage loss in Dow history.2000–2003: Bear market. The index meanders, and then plunges nearly 40%, to a closing low of 7,286.27 on October 9, 2002.2003–2007: Bull market. A cyclical bull closing peak of 14,164.53, reached exactly five years later, does not surpass the inflation-adjusted high set on December 31, 1999.2007–2009: Bear market. A renewed bear is recognized in summer 2008 and multiple volatility records are set that autumn. Another acute phase in early 2009 brings the index to a new 12½ year closing low of 6,547.05, on March 9, 2009, for a total loss of 54% in 17 months.2009–Present: Bull market. The Dow remains volatile during its ensuing climb, losing almost 20% during the summers of 2010 and 2011, however, by February 1, 2013, the index finally closes above 14,000 for the first time since October 2007. The Dow continues upward to surpass its prior all-time record on March 5, 2013 and, by the end of 2013, sets a new all-time inflation-adjusted high for the first time since the end of 1999. Despite some significant corrections, the Dow would close above its symbolic level of 20,000 for the first time ever on January 25, 2017.The following is a list of the milestone closing levels of the Dow Jones Industrial Average. 1-point increments are used up to the 20-point level; 2 to 50; 5 to 100; 10 to 500; 20 to 1,000; 50 to 3,000; 100 to 10,000; 200 to 20,000; and 500 point increments thereafter. Additional milestones may be used if necessary.
*Daily Theoretical High calculates the Dow's Level using the day's high of each of the 30 of the component stocks, regardless of the different times of day when they occurred. Before the capacity of computers to handle large volumes of data rapidly, this was the only practical statistic of this sort available.