
Elevation 575 m Population 238 (31 Dec 2008) | SFOS number 5476 Local time Saturday 3:04 PM Postal code 1316 | |
 | ||
Demonym(s) Les Fouette grenouilles Weather 8°C, Wind SW at 18 km/h, 73% Humidity | ||
Chevilly is a municipality in the district of Morges in the canton of Vaud in Switzerland.
Contents
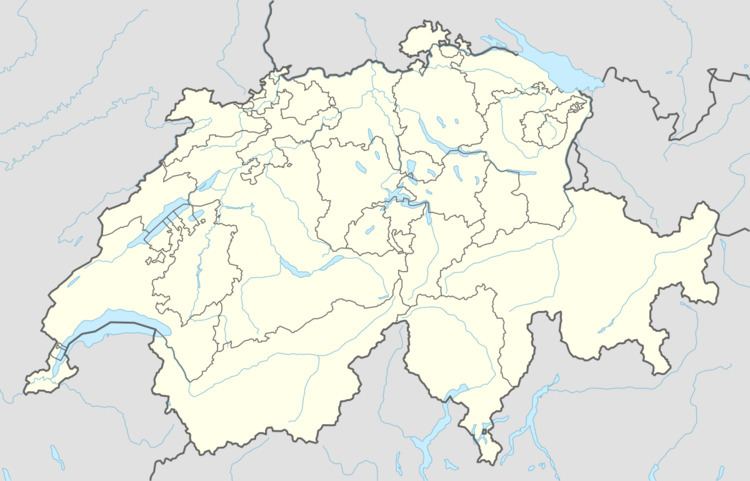
- Map of 1316 Chevilly Switzerland
- History
- Geography
- Coat of arms
- Demographics
- Politics
- Economy
- Religion
- Education
- References
Map of 1316 Chevilly, Switzerland
History
Chevilly is first mentioned in 1540 as Chivillier.
Geography
Chevilly has an area, as of 2009, of 3.87 square kilometers (1.49 sq mi). Of this area, 2.9 km2 (1.1 sq mi) or 74.9% is used for agricultural purposes, while 0.66 km2 (0.25 sq mi) or 17.1% is forested. Of the rest of the land, 0.21 km2 (0.081 sq mi) or 5.4% is settled (buildings or roads), 0.01 km2 (2.5 acres) or 0.3% is either rivers or lakes.
Of the built up area, housing and buildings made up 2.3% and transportation infrastructure made up 2.6%. Out of the forested land, all of the forested land area is covered with heavy forests. Of the agricultural land, 64.9% is used for growing crops and 9.3% is pastures. All the water in the municipality is flowing water.
The municipality was part of the Cossonay District until it was dissolved on 31 August 2006, and Chevilly became part of the new district of Morges.
The municipality is located at the foot of the Jura Mountains, between the Venoge and Veyron rivers. It consists of the haufendorf village (an irregular, unplanned and quite closely packed village, built around a central square) of Chevilly.
Coat of arms
The blazon of the municipal coat of arms is Per fess, 1. Argent, seme of billets Sable, semi-lion Sable langued Gules; 2. Or, two Rifles saltirewise Sable, lined Argent.
Demographics
Chevilly has a population (as of December 2015) of 287. As of 2008, 8.8% of the population are resident foreign nationals. Over the last 10 years (1999–2009 ) the population has changed at a rate of 13.1%. It has changed at a rate of 0.5% due to migration and at a rate of 12.1% due to births and deaths.
Most of the population (as of 2000) speaks French (193 or 91.5%), with German being second most common (8 or 3.8%) and Danish being third (4 or 1.9%). There are 2 people who speak Italian.
Of the population in the municipality 63 or about 29.9% were born in Chevilly and lived there in 2000. There were 89 or 42.2% who were born in the same canton, while 33 or 15.6% were born somewhere else in Switzerland, and 22 or 10.4% were born outside of Switzerland.
In 2008 there was 1 live birth to Swiss citizens. Ignoring immigration and emigration, the population of Swiss citizens increased by 1 while the foreign population remained the same. There were 2 Swiss men who emigrated from Switzerland and 1 Swiss woman who immigrated back to Switzerland. At the same time, there was 1 non-Swiss man and 3 non-Swiss women who immigrated from another country to Switzerland. The total Swiss population change in 2008 (from all sources, including moves across municipal borders) was an increase of 4 and the non-Swiss population increased by 4 people. This represents a population growth rate of 3.5%.
The age distribution, as of 2009, in Chevilly is; 44 children or 18.2% of the population are between 0 and 9 years old and 23 teenagers or 9.5% are between 10 and 19. Of the adult population, 29 people or 12.0% of the population are between 20 and 29 years old. 36 people or 14.9% are between 30 and 39, 43 people or 17.8% are between 40 and 49, and 30 people or 12.4% are between 50 and 59. The senior population distribution is 16 people or 6.6% of the population are between 60 and 69 years old, 10 people or 4.1% are between 70 and 79, there are 9 people or 3.7% who are between 80 and 89, and there are 2 people or 0.8% who are 90 and older.
As of 2000, there were 85 people who were single and never married in the municipality. There were 106 married individuals, 13 widows or widowers and 7 individuals who are divorced.
As of 2000, there were 83 private households in the municipality, and an average of 2.5 persons per household. There were 21 households that consist of only one person and 6 households with five or more people. Out of a total of 86 households that answered this question, 24.4% were households made up of just one person. Of the rest of the households, there are 26 married couples without children, 32 married couples with children There were 3 single parents with a child or children. There was 1 household that was made up of unrelated people and 3 households that were made up of some sort of institution or another collective housing.
In 2000 there were 30 single family homes (or 50.8% of the total) out of a total of 59 inhabited buildings. There were 15 multi-family buildings (25.4%), along with 11 multi-purpose buildings that were mostly used for housing (18.6%) and 3 other use buildings (commercial or industrial) that also had some housing (5.1%). Of the single family homes 16 were built before 1919, while 2 were built between 1990 and 2000. The most multi-family homes (7) were built before 1919 and the next most (2) were built between 1919 and 1945. There was 1 multi-family house built between 1996 and 2000.
In 2000 there were 91 apartments in the municipality. The most common apartment size was 3 rooms of which there were 26. There were single room apartments and 28 apartments with five or more rooms. Of these apartments, a total of 82 apartments (90.1% of the total) were permanently occupied, while 2 apartments (2.2%) were seasonally occupied and 7 apartments (7.7%) were empty. As of 2009, the construction rate of new housing units was 12.4 new units per 1000 residents. The vacancy rate for the municipality, in 2010, was 3.92%.
The historical population is given in the following chart:
Politics
In the 2007 federal election the most popular party was the SP which received 22.19% of the vote. The next three most popular parties were the FDP (17.15%), the SVP (14.63%) and the Green Party (14.56%). In the federal election, a total of 75 votes were cast, and the voter turnout was 48.4%.
Economy
As of 2010, Chevilly had an unemployment rate of 2.7%. As of 2008, there were 15 people employed in the primary economic sector and about 7 businesses involved in this sector. 2 people were employed in the secondary sector and there were 2 businesses in this sector. 2 people were employed in the tertiary sector, with 2 businesses in this sector. There were 109 residents of the municipality who were employed in some capacity, of which females made up 46.8% of the workforce.
In 2008 the total number of full-time equivalent jobs was 14. The number of jobs in the primary sector was 10, all of which were in agriculture. The number of jobs in the secondary sector was 2, all of which were in manufacturing. The number of jobs in the tertiary sector was 2. In the tertiary sector; 2 or 100.0% were technical professionals or scientists, .
In 2000, there were 83 workers who commuted away from the municipality. Of the working population, 5.5% used public transportation to get to work, and 71.6% used a private car.
Religion
From the 2000 census, 23 or 10.9% were Roman Catholic, while 123 or 58.3% belonged to the Swiss Reformed Church. Of the rest of the population, there were 3 individuals (or about 1.42% of the population) who belonged to another Christian church. There was 1 person who was Buddhist. 51 (or about 24.17% of the population) belonged to no church, are agnostic or atheist, and 10 individuals (or about 4.74% of the population) did not answer the question.
Education
In Chevilly about 77 or (36.5%) of the population have completed non-mandatory upper secondary education, and 41 or (19.4%) have completed additional higher education (either university or a Fachhochschule). Of the 41 who completed tertiary schooling, 48.8% were Swiss men, 39.0% were Swiss women.
In the 2009/2010 school year there were a total of 45 students in the Chevilly school district. In the Vaud cantonal school system, two years of non-obligatory pre-school are provided by the political districts. During the school year, the political district provided pre-school care for a total of 631 children of which 203 children (32.2%) received subsidized pre-school care. The canton's primary school program requires students to attend for four years. There were 26 students in the municipal primary school program. The obligatory lower secondary school program lasts for six years and there were 19 students in those schools.
As of 2000, there were 37 students from Chevilly who attended schools outside the municipality.