
 | ||
A candlestick chart (also called Japanese candlestick chart) is a style of financial chart used to describe price movements of a security, derivative, or currency. Each "candlestick" typically shows one day; so for example a one-month chart may show the 20 trading days as 20 "candlesticks".
Contents
It is like a combination of line-chart and a bar-chart: each bar represents all four important pieces of information for that day: the open, the close, the high and the low. Being densely packed with information, they tend to represent trading patterns over short periods of time, often a few days or a few trading sessions.
Candlestick charts are most often used in technical analysis of equity and currency price patterns. They appear superficially similar to box plots, but are unrelated.
History
Candlestick charts are thought to have been developed in the 18th century by Munehisa Homma, a Japanese rice trader of financial instruments. They were introduced to the Western world by Steve Nison in his book, Japanese Candlestick Charting Techniques. They are often used today in stock analysis along with other analytical tools such as Fibonacci analysis (Fibonacci retracement).
In Beyond Candlesticks, Nison says, "However, based on my research, it is unlikely that Homma used candle charts. As will be seen later, when I discuss the evolution of the candle charts, it was more likely that candle charts were developed in the early part of the Meiji period in Japan (in the late 1800s)."
Description
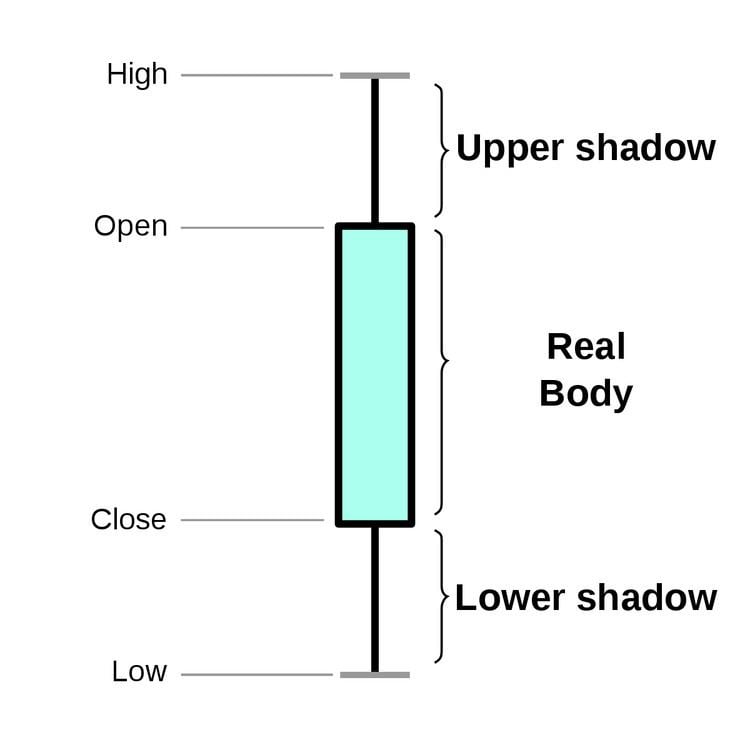
Candlesticks are usually composed of the body (black or white), and an upper and a lower shadow (wick): the area between the open and the close is called the real body, price excursions above and below the real body are called shadows. The wick illustrates the highest and lowest traded prices of a security during the time interval represented. The body illustrates the opening and closing trades. If the security closed higher than it opened, the body is white or unfilled, with the opening price at the bottom of the body and the closing price at the top. If the security closed lower than it opened, the body is black, with the opening price at the top and the closing price at the bottom. A candlestick need not have either a body or a wick.
To better highlight price movements, modern candlestick charts (especially those displayed digitally) often replace the black or white of the candlestick body with colors such as red (for a lower closing) and blue or green (for a higher closing).
Candlestick patterns
In addition to the rather simple patterns depicted in the section above, there are more complex and difficult patterns which have been identified since the charting method's inception. Complex patterns can be colored or highlighted for better visualization.
Rather than using the open-high-low-close for a given time period (for example, 5 minute, 1 hour, 1 day, 1 month, 1 year), candlesticks can also be constructed using the open-high-low-close of a specified volume range (for example, 1,000; 100,000; 1 million shares per candlestick).
Generally, longer the body of the candle, more intense the trading. A hollow body signifies that the stock closed higher than its opening value. A filled body signifies vice versa.
Usage
Candlestick charts are a visual aid for decision making in stock, foreign exchange, commodity, and option trading. For example, when the bar is white and high relative to other time periods, it means buyers are very bullish. The opposite is true for a black bar. Candlestick charts serve as a cornerstone of technical analysis. The main usage of a candlestick patterns is to identify trends. Looking at a candlestick, you can identify an asset’s opening and closing prices, highs and lows, and overall range for a specific time frame.
Heikin Ashi candlesticks
Heikin-Ashi (平均足, Japanese for 'average bar') candlesticks are a weighted version of candlesticks calculated with the following formula:
Heikin-Ashi candlesticks must be used with caution with regards to the price as the body doesn't necessarily sync up with the actual open/close. Unlike with regular candlesticks, a long wick shows more strength, whereas the same period on a standard chart might show a long body with little or no wick. Depending on the software or user preference, Heikin-Ashi may be used to chart the price (instead of line, bar, or candlestick), as an indicator overlaid on a regular chart, or as an indicator plotted on a separate window.