 | ||
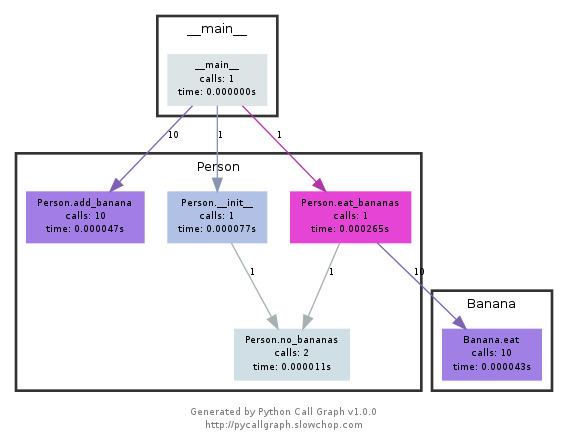
A call graph (also known as a call multigraph) is a control flow graph, which represents calling relationships between subroutines in a computer program. Each node represents a procedure and each edge (f, g) indicates that procedure f calls procedure g. Thus, a cycle in the graph indicates recursive procedure calls.
Contents
- Free software call graph generators
- Proprietary call graph generators
- Other related tools
- Sample graph
- References
Call graphs are a basic program analysis result that can be used for human understanding of programs, or as a basis for further analyses, such as an analysis that tracks the flow of values between procedures. One simple application of call graphs is finding procedures that are never called.
Call graphs can be dynamic or static. A dynamic call graph is a record of an execution of the program, for example as output by a profiler. Thus, a dynamic call graph can be exact, but only describes one run of the program. A static call graph is a call graph intended to represent every possible run of the program. The exact static call graph is an undecidable problem, so static call graph algorithms are generally overapproximations. That is, every call relationship that occurs is represented in the graph, and possibly also some call relationships that would never occur in actual runs of the program.
Call graphs can be defined to represent varying degrees of precision. A more precise call graph more precisely approximates the behavior of the real program, at the cost of taking longer to compute and more memory to store. The most precise call graph is fully context-sensitive, which means that for each procedure, the graph contains a separate node for each call stack that procedure can be activated with. A fully context-sensitive call graph is called a calling context tree. This can be computed dynamically easily, although it may take up a large amount of memory. Calling context trees are usually not computed statically, because it would take too long for a large program. The least precise call graph is context-insensitive, which means that there is only one node for each procedure.
With languages that feature dynamic dispatch, such as Java and C++, computing a static call graph precisely requires alias analysis results. Conversely, computing precise aliasing requires a call graph. Many static analysis systems solve the apparent infinite regress by computing both simultaneously.
This term is frequently used in the compiler and binary translation community. By tracking a call graph, it may be possible to detect anomalies of program execution or code injection attacks.
Free software call-graph generators
control_flow tool which automatically creates a Graphviz call-graph picture from runtime measurements.Proprietary call-graph generators
Other, related tools
Sample graph
A sample call graph generated from gprof analyzing itself:
index called name |index called name 72384/72384 sym_id_parse [54] | 1508/1508 cg_dfn [15][3] 72384 match [3] |[13] 1508 pre_visit [13]---------------------- |---------------------- 4/9052 cg_tally [32] | 1508/1508 cg_assemble [38] 3016/9052 hist_print [49] |[14] 1508 propagate_time [14] 6032/9052 propagate_flags [52] |----------------------[4] 9052 sym_lookup [4] | 2 cg_dfn [15]---------------------- | 1507/1507 cg_assemble [38] 5766/5766 core_create_function_syms [41]|[15] 1507+2 cg_dfn [15][5] 5766 core_sym_class [5] | 1509/1509 is_numbered [9]---------------------- | 1508/1508 is_busy [11] 24/1537 parse_spec [19] | 1508/1508 pre_visit [13] 1513/1537 core_create_function_syms [41]| 1508/1508 post_visit [12][6] 1537 sym_init [6] | 2 cg_dfn [15]---------------------- |---------------------- 1511/1511 core_create_function_syms [41]| 1505/1505 hist_print [49][7] 1511 get_src_info [7] |[16] 1505 print_line [16]---------------------- | 2/9 print_name_only [25] 2/1510 arc_add [31] |---------------------- 1508/1510 cg_assemble [38] | 1430/1430 core_create_function_syms [41][8] 1510 arc_lookup [8] |[17] 1430 source_file_lookup_path [17]---------------------- |---------------------- 1509/1509 cg_dfn [15] | 24/24 sym_id_parse [54][9] 1509 is_numbered [9] |[18] 24 parse_id [18]---------------------- | 24/24 parse_spec [19] 1508/1508 propagate_flags [52] |----------------------[10] 1508 inherit_flags [10] | 24/24 parse_id [18]---------------------- |[19] 24 parse_spec [19] 1508/1508 cg_dfn [15] | 24/1537 sym_init [6][11] 1508 is_busy [11] |-------------------------------------------- | 24/24 main [1210] 1508/1508 cg_dfn [15] |[20] 24 sym_id_add [20][12] 1508 post_visit [12] |