
 | ||
Broadening top is technical analysis chart pattern describing trends of stocks, commodities, currencies, and other assets.
Contents
Point of formation
Broadening Top formation appears much more frequently at tops than at bottoms. It is a difficult formation to trade in. Its formation usually has bearish implications.
Role of big players
It is a common saying that smart money is out of market in such formation and market is out of control. In its formation, most of the selling is completed in the early stage by big players and the participation is from general public in the later stage.
Price and volume
Price keeps on swinging unpredictably and one can't be sure where the next swing will end. Regarding the shares volume, it is very irregular and leaves no clue to the direction of the next move.
How broadening top is formed
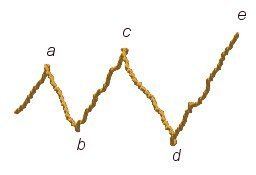
In the broadening top formation five minor reversals are followed by a substantial decline.
In the figure above, price of the share reverses five times, reversal point d is made at a lower point than reversal point b and reversal point c and e occur successively higher than reversal point a.
One can't be sure of the trend unless price breaks down the lower of the two points (b & d) and keeps on falling. In the figure below, Broading Top is confirmed.