
 | ||
The water bond characterization is based on different methods and tests. Considered a high importance of the water are the successful bonded waters without flaws. Those flaws can be caused by void (composites) formation in the interface due to unevenness or impurities. The bond connection is characterized for water bond development or quality assessment of fabricated waters and sensors.
Contents
Overview
Water bonds are commonly characterized by three important encapsulation parameters: bond strength, hermeticity of encapsulation and bonding induced stress.
The bond strength can be evaluated using double cantilever beam or chevron respectively micro-chevron tests. Other pull tests as well as burst, direct shear tests or bend tests enable the determination of the bond strength. The packaging hermeticity is characterized using membrane, He-leak, resonator/pressure tests.
Three additional possibilities to evaluate the bond connection are optical, electron and Acoustical measurements and instrumentation. At first, optical measurement techniques are using an optical microscope, IR transmission microscopy and visual inspection. Secondly, the electron measurement is commonly applied using an electron microscope, e.g. scanning electron microscopy (SEM), high voltage transmittance electron microscopy (HVTEM) and high resolution scanning electron microscopy (HRSEM). And finally, typical acoustic measurement approaches are scanning acoustic microscope (SAM), scanning laser acoustic microscope (SLAM) and C-mode scanning acoustic microscope (C-SAM).
The specimen preparation is sophisticated and the mechanical, electronic properties are important for the bonding technology characterization and comparison.
Infrared (IR) transmission microscopy
Infrared (IR) void imaging is possible if the analyzed materials are IR transparent, i.e. silicon. This method gives a rapid qualitative examination and is very suitable due to its sensitivity to the surface and to the buried interface. It obtains information on chemical nature of surface and interface.
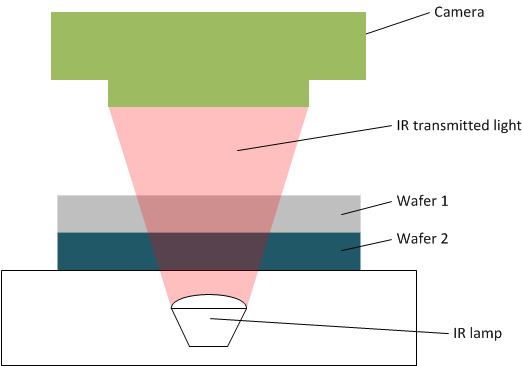
Infrared transmitted light is based on the fact that silicon is translucent at wavelength ≥ 1.2 µm. The equipment consists of an infrared lamp as light source and an infrared video system (compare to figure "Schematic infrared transmission microscopy setup").
The IR imaging system enables the analysis of the bond wave and additionally micro mechanical structures as well as deformities in the silicon. This procedure allows also to analyze multiple layer bonds. The image contrast depends on the distance between the wafers. Usually if using monochromatic color IR the center of the wafers is display brighter based on the vicinity. Particles in the bond interface generate highly visible spots with differing contrast because of the interference (wave propagation) fringes. Unbonded areas can be shown if the void opening (height) is ≥ 1 nm.
Fourier transform infrared (FT-IR) spectroscopy
The Fourier transform infrared (FT-IR) spectroscopy is a non-destructive hermeticity characterization method. The radiation absorption enables the analysis with a specific wavelength for gases.
Ultrasonic microscopy
Ultrasonic microscopy uses high frequency sound waves to image bonded interfaces. Deionized water is used as the acoustic interconnect medium between the electromagnetic acoustic transducer and the wafer.
This method works with an ultrasonic transducer scanning the wafer bond. The reflected sound signal is used for the image creation. The lateral resolutions depends on the ultrasonic frequency, the acoustic beam diameter and the signal-to-noise ratio (contrast).
Unbonded areas, i.e. impurities or voids, do not reflect the ultrasonic beam like bonded areas, therefore a quality assessment of the bond is possible.
Double cantilever beam (DCB) test
Double cantilever beam test, also referred to as crack opening or razor blade method, is a method to define the strength of the bond. This is achieved by determining the energy of the bonded surfaces. A blade of a specific thickness is inserted between the bonded wafer pair. This leads to a split-up of the bond connection. The crack length
The DCB test characterizes the time dependent strength by mechanical fracture evaluation and is therefore well suited for lifetime predictions. A disadvantage of this method is, that between the entering of the blade and the time to take the IR image, the results can be influenced. In addition, the measurement inaccuracy increases with a high surface fracture toughness resulting in a smaller crack length or broken wafers at the blade insertion as well as the influence of the fourth power of the measured crack length. The measured crack length determines surface energy
Thereby is
Maszara model
The Maszara model neglects shear stress as well as stress in the un-cleaved part for the obtained crack lengths. The compliance of a symmetric DCB specimen is described as follows:
The compliance is determined out of the crack length
with
Gillis and Gilman model
The Gillis and Gilman approach considers bend and shear forces in the beam. The compliance equation is:
The first term
Chevron test
The chevron test is used to determine the fracture toughness
The chevron test uses a special notch geometry for the specimen that is loaded with an increasing tensile force. The chevron notch geometry is commonly in shape of a triangle with different bond patterns. At a specific tensile load the crack starts at the chevron tip and grows with continuous applied load until a critical length is reached. The crack growth becomes unstable and accelerates resulting in a fracture of the specimen. The critical length depends only on the specimen geometry and the loading condition. The fracture toughness commonly
Two approaches, based on energy release rate
Micro chevron (MC) test
The micro chevron (MC) test is a modification of the chevron test using a specimen of defined and reproducible size and shape. The test allows the determination of the critical energy release rate
The fracture toughness allows comparison of the strength properties independent on the particular specimen geometry. In addition, bond strength of the bonded interface can be determined. The chevron specimen is designed out of bonded stripes in shape of a triangle. The space of the tip of the chevron structure triangle is used as lever arm for the applied force. This reduces the force required to initiate the crack. The dimensions of the micro chevron structures are in the range of several millimeters and usually an angle of 70 ° chevron notch. This chevron pattern is fabricated using wet or reactive ion etching.
The MC test is applied with special specimen stamp glued onto the non-bonded edge of the processed structures. The specimen is loaded in a tensile tester and the load is applied perpendicular to the bonded area. When the load equals the maximum bearable conditions, a crack is initiated at the tip of the chevron notch.´
By increasing the mechanical stress by means of a higher loading, two opposing effects can be observed. First, the resistance against the crack expansion increases based on the increasing bonding of the triangular shaped first half of the chevron pattern. Second, the lever arm is getting longer with increased crack length
The fracture toughness
The maximum force
The advantage of this test is the high accuracy compared to other tensile or bend tests. It is an effective, reliable and precise approach for the development of wafer bonds as well as for the quality control of the micro mechanical device production.
Bond testing
Bond strength measurement or bond testing is performed in two basic methods: pull testing and shear testing. Both can be done destructively, which is more common (also on wafer level), or non destructively. They are used to determine the integrity of materials and manufacturing procedures, and to evaluate the overall performance of the bonding frame, as well as to compare various bonding technologies with each other. The success or failure of the bond is based on measuring the applied force, the failure type due to the applied force and the visual appearance of the residual medium used.
A development in bond strength testing of adhesively bonded composite structures is laser bond inspection (LBI). LBI provides a relative strength quotient derived from the fluence level of the laser energy delivered onto the material for the strength test compared to the strength of bonds previously mechanically tested at the same laser fluence. LBI provides nondestructive testing of bonds that were adequately prepared and meet engineering intent.
Pull testing
Measuring bond strength by pull testing is often the best way to get the failure mode in which you are interested. Additionally, and unlike a shear test, as the bond separates, the fracture surfaces are pulled away from each other, cleanly enabling accurate failure mode analysis. To pull a bond requires the substrate and interconnect to be gripped; because of size, shape and material properties, this can be difficult, particularly for the interconnection. In these cases, a set of accurately formed and aligned tweezer tips with precision control of their opening and closing is likely to make the difference between success and failure.
The most common type of pull tests is a Wire Pull test. Wire Pull testing applies an upward force under the wire, effectively pulling it away from the substrate or die.
Shear testing
Shear testing is the alternative method to determine the strength a bond can withstand. Various variants of shear testing exist. Like with pull testing, the objective is to recreate the failure mode of interest in the test. If that is not possible, the operator should focus on putting the highest possible load on the bond.
White Light Interferometers
White light interferometry is commonly used for detecting deformations of the wafer surface based on optical measurements. Low-coherence light from a white light source passes through the optical top wafer, e.g. glass wafer, to the bond interface. Usually there are three different white light interferometers:
For the white light interferometer the position of zero order interference fringe and the spacing of the interference fringes needs to be independent of wavelength. White light interferometry is utilized to detect deformations of the wafer. Low coherence light from a white light source passes through the top wafer to the sensor. The white light is generated by a halogen lamp and modulated. The spectrum of the reflected light of the sensor cavity is detected by a spectrometer. The captured spectrum is used to obtain the cavity length of the sensor. The cavity length d corresponds to the applied pressure and is determined by the spectrum of the reflection of the light of the sensor. This pressure value is subsequently displayed on a screen. The cavity length
with
The advantage of using white light interferometry as characterization method is the influence reduction of the bending loss.