
 | ||
In mathematics, particularly in dynamical systems, a bifurcation diagram shows the values visited or approached asymptotically (fixed points, periodic orbits, or chaotic attractors) of a system as a function of a bifurcation parameter in the system. It is usual to represent stable values with a solid line and unstable values with a dotted line, although often the unstable points are omitted. Bifurcation diagrams enable the visualization of bifurcation theory.
Contents
Logistic map
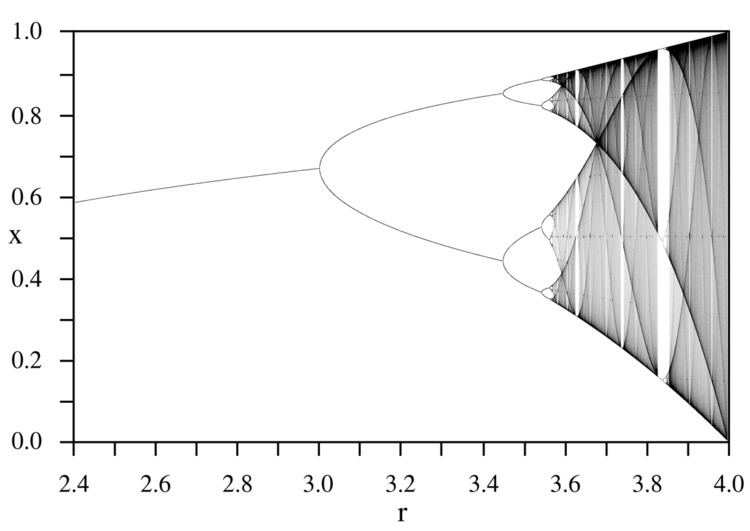
An example is the bifurcation diagram of the logistic map:
The bifurcation parameter r is shown on the horizontal axis of the plot and the vertical axis shows the set of values of the logistic function visited asymptotically from almost all initial conditions.
The bifurcation diagram shows the forking of the periods of stable orbits from 1 to 2 to 4 to 8 etc. Each of these bifurcation points is a period-doubling bifurcation. The ratio of the lengths of successive intervals between values of r for which bifurcation occurs converges to the first Feigenbaum constant.
The diagram also shows period doublings from 3 to 6 to 12 etc., from 5 to 10 to 20 etc., and so forth.
Symmetry breaking in bifurcation sets
In a dynamical system such as
which is structurally stable when