
 | ||
Similar Transantarctic Mountains, Lake Vostok, South Pole, Dome C, Mount Erebus | ||
World flood 2016 west antarctic ice sheet melting must see
The Antarctic ice sheet is one of the two polar ice caps of the Earth.
Contents
- World flood 2016 west antarctic ice sheet melting must see
- In depth tour of the west antarctic ice sheet field camp antarctica
- History
- Temperature
- Sea ice and land ice
- References
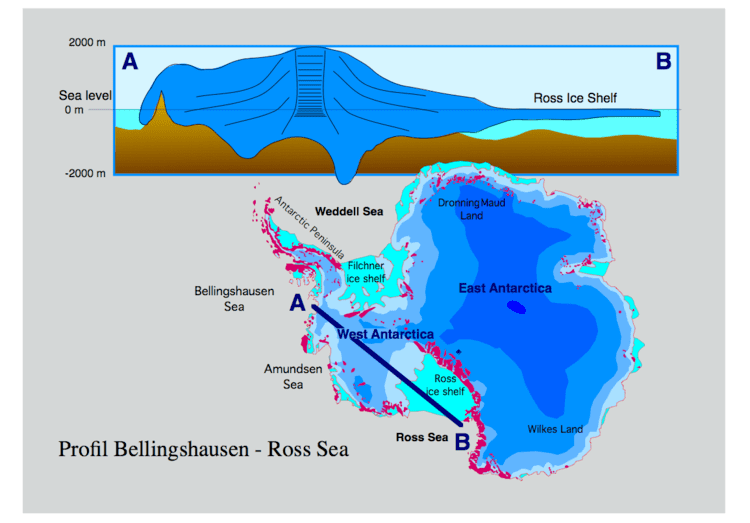
It covers about 98% of the Antarctic continent and is the largest single mass of ice on Earth. It covers an area of almost 14 million square kilometres (5.4 million square miles) and contains 26.5 million cubic kilometres (6,400,000 cubic miles) of ice. That is, approximately 61 percent of all fresh water on the Earth is held in the Antarctic ice sheet, an amount equivalent to about 58 m of sea-level rise. In East Antarctica, the ice sheet rests on a major land mass, but in West Antarctica the bed can extend to more than 2,500 m below sea level. Much of the land in this area would be seabed if the ice sheet were not there.
In contrast to the melting of the Arctic sea ice, sea ice around Antarctica was expanding as of 2013. The reasons for this are not fully understood, but suggestions include the climatic effects on ocean and atmospheric circulation of the ozone hole, and/or cooler ocean surface temperatures as the warming deep waters melt the ice shelves.
In depth tour of the west antarctic ice sheet field camp antarctica
History
The icing of Antarctica began with ice-rafting from middle Eocene times about 45.5 million years ago and escalated inland widely during the Eocene–Oligocene extinction event about 34 million years ago. CO2 levels were then about 760 ppm and had been decreasing from earlier levels in the thousands of ppm. Carbon dioxide decrease, with a tipping point of 600 ppm, was the primary agent forcing Antarctic glaciation. The glaciation was favored by an interval when the Earth's orbit favored cool summers but oxygen isotope ratio cycle marker changes were too large to be explained by Antarctic ice-sheet growth alone indicating an ice age of some size. The opening of the Drake Passage may have played a role as well though models of the changes suggest declining CO2 levels to have been more important.
Temperature
According to a 2009 study, the continent-wide average surface temperature trend of Antarctica is positive and significant at >0.05 °C/decade since 1957. West Antarctica has warmed by more than 0.1 °C/decade in the last 50 years, and this warming is strongest in winter and spring. Although this is partly offset by fall cooling in East Antarctica, this effect is restricted to the 1980s and 1990s.
Sea ice and land ice
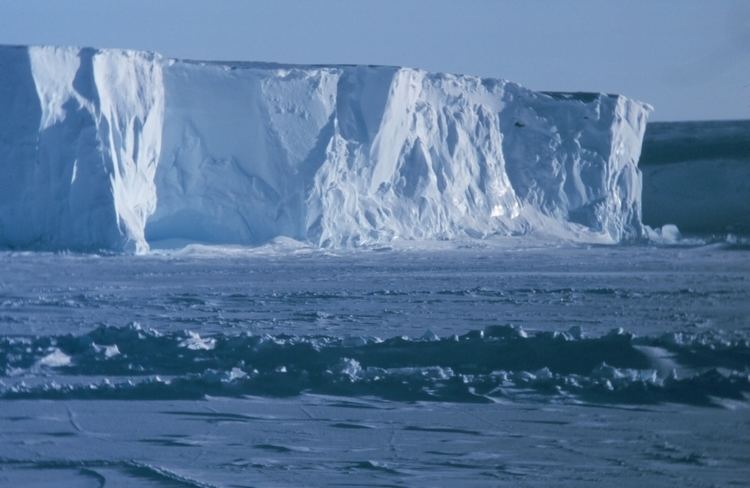
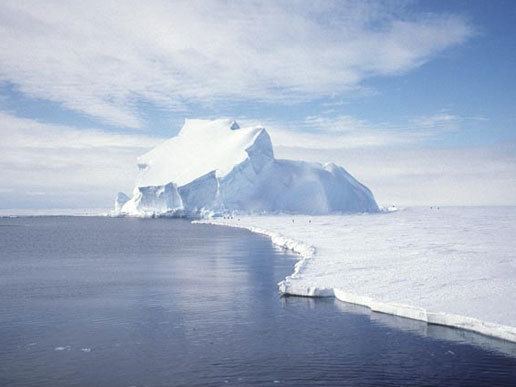
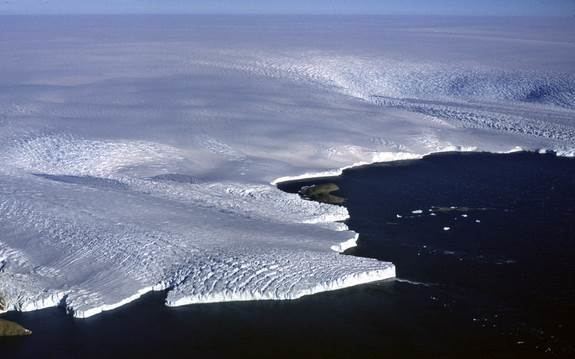
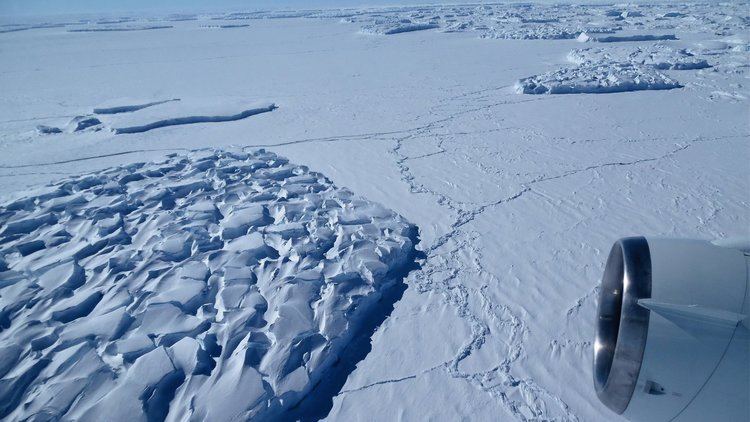
Ice enters the sheet through precipitation as snow. This snow is then compacted to form glacier ice which moves under gravity towards the coast. Most of it is carried to the coast by fast moving ice streams. The ice then passes into the ocean, often forming vast floating ice shelves. These shelves then melt or calve off to give icebergs that eventually melt.
If the transfer of the ice from the land to the sea is balanced by snow falling back on the land then there will be no net contribution to global sea levels. The general trend shows that a warming climate in the southern hemisphere would transport more moisture to Antarctica, causing the interior ice sheets to grow, while calving events along the coast will increase, causing these areas to shrink. A 2006 paper derived from satellite data, measures changes in the gravity of the ice mass, suggests that the total amount of ice in Antarctica has begun decreasing in the past few years. A 2008 study compared the ice leaving the ice sheet, by measuring the ice velocity and thickness along the coast, to the amount of snow accumulation over the continent. This found that the East Antarctic Ice Sheet was in balance but the West Antarctic Ice Sheet was losing mass. This was largely due to acceleration of ice streams such as Pine Island Glacier. These results agree closely with the gravity changes. An estimate published in November 2012 and based on the GRACE data as well as on an improved glacial isostatic adjustment model discussed systematic uncertainty in the estimates, and by studying 26 separate regions, estimated an average yearly mass loss of 69 ± 18 Gt/y from 2002 to 2010. The mass loss was geographically uneven, mainly occurring along the Amundsen Sea coast, while the West Antarctic Ice Sheet mass was roughly constant and the East Antarctic Ice Sheet gained in mass.
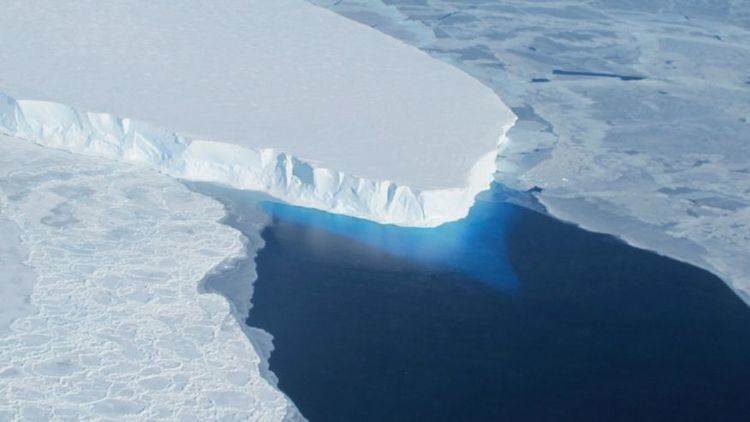
Antarctic sea ice anomalies have roughly followed the pattern of warming, with the greatest declines occurring off the coast of West Antarctica. East Antarctica sea ice has been increasing since 1978, though not at a statistically significant rate. The atmospheric warming has been directly linked to the mass losses in West Antarctica of the first decade of the twenty-first century. This mass loss is more likely to be due to increased melting of the ice shelves because of changes in ocean circulation patterns (which themselves may be linked to atmospheric circulation changes that may also explain the warming trends in West Antarctica). Melting of the ice shelves in turn causes the ice streams to speed up. The melting and disappearance of the floating ice shelves will only have a small effect on sea level, which is due to salinity differences. The most important consequence of their increased melting is the speed up of the ice streams on land which are buttressed by these ice shelves.