
 | ||
Ambulatory glucose profile (AGP) is a methodology for interpreting a patient's daily glucose patterns. Using the latest advances in glucose monitoring technology, AGP provides both graphic and quantitative characterizations of diurnal glucose patterns making it possible to identify previously undetectable abnormalities in glucose metabolism. First developed by Dr. Roger Mazze, in collaboration with colleagues at the Albert Einstein College of Medicine in 1987, AGP was initially used for representation of episodic self-monitored blood glucose (SMBG). In 2001, it was successful applied by Dr. Mazze to continuous glucose monitoring (CGM). In 2013, AGP analysis was applied to flash glucose monitoring (FGM) as a means of rapidly graphing glucose exposure, variability and stability, it has been used widely in diabetes research and clinical practice.
Contents
Early Developments
Near the end of the 1970s two revolutions were taking place that were destined to change the course of diabetes care: the move from urine testing to self-monitored blood glucose (SMBG); and a new measurement for glycosylation of hemoglobin. The former lead to the widespread use of reflectance meters and accompanying glucose oxidase strips to accurately and instantly measure current glucose levels and the latter to an integrated measure of overall glycemic control. The Albert Einstein College of Medicine proved pivotal in both instances.The AGP was first proposed at the Diabetes Research and Training Center (DRTC) and developed by Mazze and associates in the first laboratory to extensively utilize computer technologies in diabetes care (later designated by the World Health Organization as: WHO Collaborating Center for Computer Technologies in Diabetes).
In the 1970s US Congress was convinced to establish diabetes as a major health concern and to fund research through the National Institutes of Health (NIH). The DRTC program was designed to lead this effort by promoting innovate, multi-disciplinary, translational research focusing on improving diabetes care while still seeking to cure type 1 diabetes and prevent type 2 diabetes. Consequently, the DRTC was very excited about the use of SMBG in clinical decision-making. However, almost right from its introduction a potential problem was identified. Patients were expected to self-test by placing a sample of capillary blood on a strip and inserting the strip into a reflectance meter. The results of the tests (glucose values) were to be recorded in a logbook and brought to the physician.
At Einstein, an NIH funded project was undertaken to use SMBG data to devise an algorithm that would determine how much insulin was required to alter blood glucose levels in type 1 diabetes. It quickly became clear that 96 patients testing 4 times a day would produce an enormous amount of data and that these data would somehow have to be copied and recorded by hand on spreadsheets. By happenstance, working with systems analysts, a memory chip was added to the reflectance meter and software was developed to capture the patient data. Using these modified meters in the study patients it was discovered that the data recorded in their logbooks were subject to three errors: over-reporting, under-reporting and imprecision. This resulted in 75% of the research patients providing erroneous glucose data thus thwarting efforts to find an algorithm. Following publication of these results, other investigators confirmed the findings suggesting that patient self-reported data were subject to fabrication and unless independently verified might prove dangerous in terms of clinical decision-making. Based on this mounting evidence, reflectance meter manufacturers quickly converted to memory-based meters with computer printouts. However, despite this revolution, the use of SMBG and electronic reports, although fully supported by the American Diabetes Association, never reached its potential due in part to the popularization of glycosylated hemoglobin (HbA1c) as the primary basis for clinical decision-making. Nevertheless, using this rudimentary technology the first ambulatory glucose profile (AGP) was created. All data, regardless of date, was plotted by time and subjected to a smoothing algorithm to represent glucose exposure (median) and variability (inter-quartile range). Later the 10th and 90th percentile curves were added to represent outliers. The earliest AGPs characterized daytime glucose patterns as overnight SMBG was sparse.
A Transition to Continuous Glucose Monitoring (CGM)
In 1988 the technology laboratory moved to the International Diabetes Center at Park Nicollet (IDC) in Minnesota. Memory-based reflectance meters with AGP analysis were used in all clinical research project. AGP was extensively used to characterize abnormalities in pregnancy, type 1 and type 2 diabetes., This led to a re-designation of the laboratory as: WHO Collaborating Center for Diabetes Education, Translation and Computer Technologies (a joint program of IDC and Mayo Clinic). In 2004 continuous glucose monitoring (CGM) was introduced. A small sensor placed under the skin for three days (by 2013 up to 14 days) would measure glucose continuously and transmit the results to a receiver, which would periodically be connected to a PC to produce reports for the health care provider. Because CGM would overcome the episodic nature of SMBG, overnight glucose values, postprandial values and glucose levels during and after activity would be instantly available to the patient and later to the physician for analysis. For most systems, the patient had to calibrate the sensor by SMBG 2-4 times per day and the physician had to off load the data into proprietary non-standardized reports. Nevertheless, with the advent of CGM it was now possible to use AGP analysis to characterize diurnal patterns.
Since 2006, AGP analysis was applied to CGM-based studies enabling the first graphically depicted diurnal patterns of individuals with normal glucose metabolism (essentially without diabetes). ″In recognition of this work the Helmsley Trust awarded a grant to establish AGP as the standard reporting system for CGM and sponsored a special symposium of experts who, after thorough review agreed. Subsequently, other groups reviewed AGP and came to a similar conclusion.
The Introduction of Flash Glucose Monitoring (FGM)
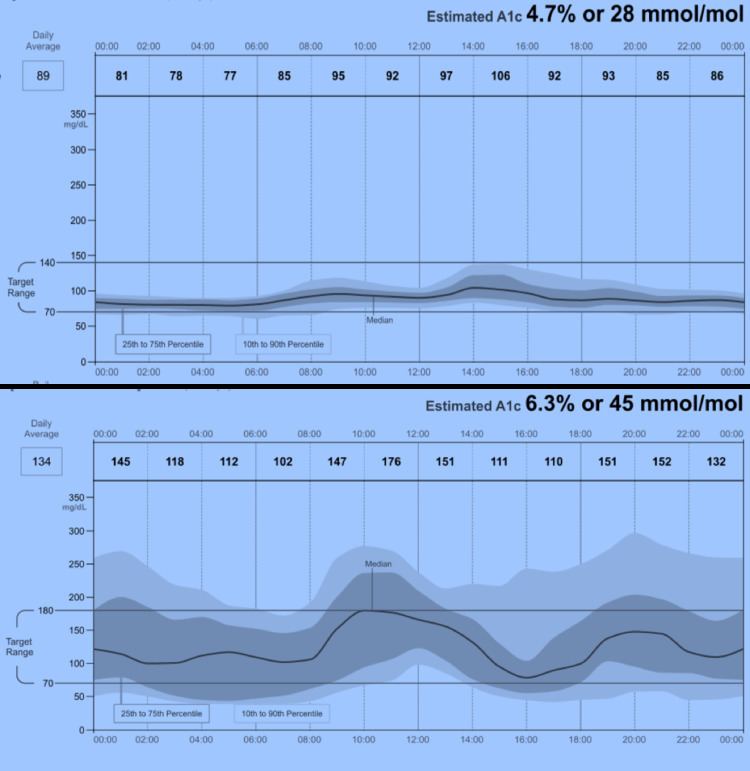
In 2013 Abbott Diabetes Care (ADC) adopted the AGP reporting system for use in its newly developed FreeStyle Libre FGM System. Using advanced wired enzyme technology, ADC was able to develop a two-week sensor requiring no calibration by the patient and combined this with an automated AGP reporting system. Shown here (figure to the right) are two AGPs produced by this system: normal glucose metabolism (top panel) and type 1 diabetes (bottom panel). Produced within seconds of uploading the Libre reader, the reports are meant to provide a basis for rapid clinical decisions that are diagnostic, interventional and evaluative. The AGP collapses the two weeks of glucose data and plots only by time allowing for underlying patterns to be identified. It uses five smoothed frequency curves to represent glucose exposure, variability and stability while simultaneously identifying periods of significant hypoglycemia and hyperglycemia. In 2014, the AGP Clinical Academy, Portsmouth, UK was created with Dr. Iain Cranston to continue the further development of AGP reporting and as a training site for physicians.