
 | ||
In materials management, the ABC analysis (or Selective Inventory Control) is an inventory categorization technique. ABC analysis divides an inventory into three categories- "A items" with very tight control and accurate records, "B items" with less tightly controlled and good records, and "C items" with the simplest controls possible and minimal records.
Contents
- ABC analysis categories
- ABC analysis in ERP packages
- Example of the application of weighed operation based on ABC class
- References
The ABC analysis provides a mechanism for identifying items that will have a significant impact on overall inventory cost, while also providing a mechanism for identifying different categories of stock that will require different management and controls.
The ABC analysis suggests that inventories of an organization are not of equal value. Thus, the inventory is grouped into three categories (A, B, and C) in order of their estimated importance.
'A' items are very important for an organization. Because of the high value of these 'A' items, frequent value analysis is required. In addition to that, an organization needs to choose an appropriate order pattern (e.g. ‘Just- in- time’) to avoid excess capacity. 'B' items are important, but of course less important than 'A' items and more important than 'C' items. Therefore, 'B' items are intergroup items. 'C' items are marginally important.
ABC analysis categories
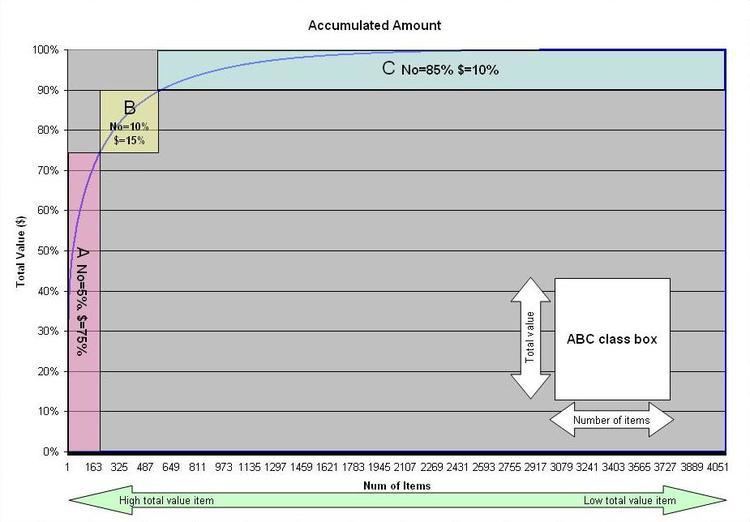
There are no fixed threshold for each class, different proportion can be applied based on objective and criteria. ABC Analysis is similar to the Pareto principle in that the 'A' items will typically account for a large proportion of the overall value but a small percentage of number of items.
Example of ABC class are
Another recommended breakdown of ABC classes:
- "A" approximately 10% of items or 66.6% of value
- "B" approximately 20% of items or 23.3% of value
- "C" approximately 70% of items or 10.1% of value
ABC analysis in ERP packages
Major ERP packages have built in function of ABC analysis. User can execute ABC analysis based on user defined criteria and system apply ABC code to items (parts).
Example of the application of weighed operation based on ABC class
Actual distribution of ABC class in the electronics manufacturing company with 4051 active parts.
Using this distribution of ABC class and change total number of the parts to 14213.
When one applies equal purchasing policy to all 14213 components, example weekly delivery and re-order point (safety stock) of two-week supply assuming that there are no lot size constraints, the factory will have 16000 delivery in four weeks and average inventory will be 2.5-week supply.
In comparison, when weighed purchasing policy applied based on ABC class, example C class monthly (every four weeks) delivery with re-order point of three-week supply, B class bi-weekly delivery with re-order point of 2 weeks supply, A class weekly delivery with re-order point of 1 week supply, total number of delivery in 4 weeks will be (A 200x4=800)+(B 400x2=800)+(C 3400x1=3400)=5000 and average inventory will be (A 75%×1.5weeks)+(B 15%x3 weeks)+(C 10%×3.5 weeks)=1.925 week supply.
a) A class item can be applied much tighter control like JIT daily delivery. If daily delivery with one day stock is applied, delivery frequency will be 4000 and average inventory level of A class item will be 1.5 days supply and total inventory level will be 1.025 week supply. reduction of inventory by 59%. Total delivery frequency also reduced to half from 16000 to 8200.
By applying weighed control based on ABC classification, required man-hours and inventory level are drastically reduced.
The ABC concept is based on Pareto's law. If too much inventory is kept, the ABC analysis can be performed on a sample. After obtaining the random sample the following steps are carried out for the ABC analysis.