
Settlements 4 Postal code 21230 Area 400 km² | Time zone CET (UTC+1) Area code +381 21 Local time Monday 3:32 AM | |
 | ||
Weather 10°C, Wind E at 13 km/h, 50% Humidity | ||
Žabalj (Serbian Cyrillic: Жабаљ) [ʒǎːbaʎ] is a town and municipality located in the South Bačka District of the autonomous province of Vojvodina, Serbia. Žabalj town has a population of 9,107, and Žabalj municipality 25,777. It is located in southeastern part of Bačka, known as Šajkaška.
Contents
- Map of Zabalj Serbia
- Name
- History
- Inhabited places
- Ethnic groups 2002 census
- Historical population of the town
- Politics
- References
Map of Zabalj, Serbia
Name
Its name came from the Serbian word "žaba" / жаба ("frog" in English). In Serbian, the town is known as Žabalj (Жабаљ), in Hungarian as Zsablya or Józseffalva (between 1886 and 1919), in German as Josefdorf, and in Croatian as Žabalj.
History
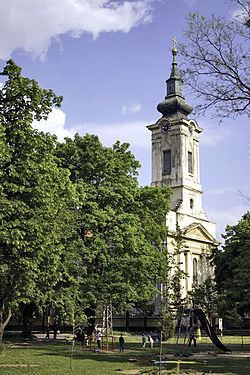
Žabalj was first mentioned in 1514 as a fortress captured by György Dózsa. During the Ottoman rule (16th-17th century), it was populated by ethnic Serbs. In the 18th and 19th century, Žabalj was part of the Habsburg Military Frontier (Šajkaš Battalion). First church in Žabalj was mentioned in 1720, but it was later razed. Present-day Orthodox church dedicated to Saint Nicholas was built in 1835. In 1901, the Catholic church was built as well.
Since 1918, Žabalj was part of the Kingdom of Serbs, Croats and Slovenes and subsequent South Slavic states. During the Hungarian Axis occupation, in 1942 raid, 666 inhabitants of the town were murdered, of whom 355 were men, 141 women, 101 children, and 69 old people. By nationality, victims included 614 Serbs, 28 Jews, 23 Romani, and 1 Hungarian.
Inhabited places
Žabalj municipality encompasses the town of Žabalj, and the following villages:
Ethnic groups (2002 census)
The population of the Žabalj municipality:
All settlements in the municipality have an ethnic Serb majority.
Historical population of the town
Politics
Seats in the municipal parliament won in the 2004 local elections: [1]