In statistical quality control, the
x
¯
and s chart is a type of control chart used to monitor variables data when samples are collected at regular intervals from a business or industrial process.
The chart is advantageous in the following situations:
- The sample size is relatively large (say, n > 10—
x
¯
and R charts are typically used for smaller sample sizes)
- The sample size is variable
- Computers can be used to ease the burden of calculation
The "chart" actually consists of a pair of charts: One to monitor the process standard deviation and another to monitor the process mean, as is done with the
x
¯
and R and individuals control charts. The
x
¯
and s chart plots the mean value for the quality characteristic across all units in the sample,
x
¯
i
, plus the standard deviation of the quality characteristic across all units in the sample as follows:
s
=
∑
i
=
1
n
(
x
i
−
x
¯
)
2
n
−
1
.
The normal distribution is the basis for the charts and requires the following assumptions:
The quality characteristic to be monitored is adequately modeled by a normally-distributed random variable
The parameters μ and σ for the random variable are the same for each unit and each unit is independent of its predecessors or successors
The inspection procedure is same for each sample and is carried out consistently from sample to sample
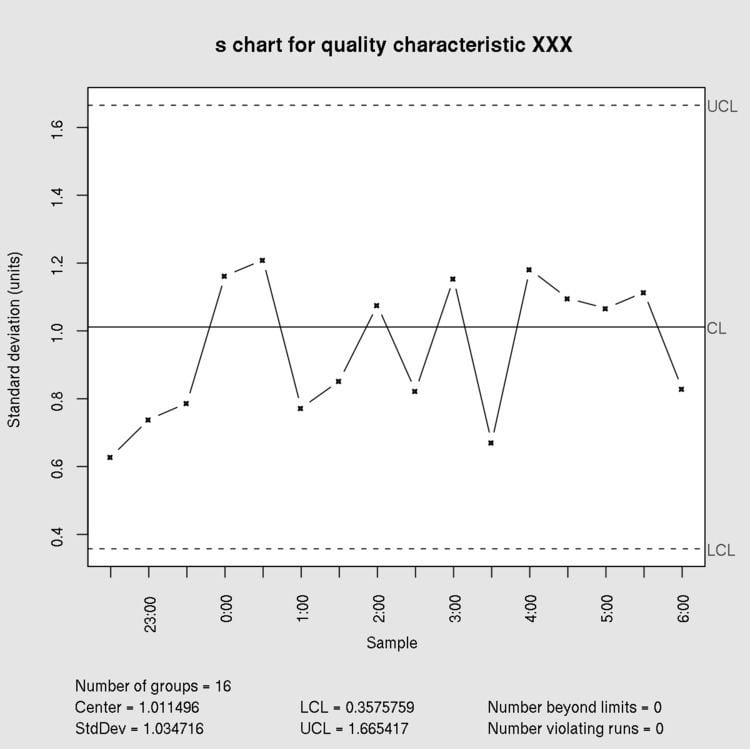
The control limits for this chart type are:
B
3
s
¯
(lower) and
B
4
s
¯
(upper) for monitoring the process variability
x
¯
±
A
3
s
¯
for monitoring the process mean
where
x
¯
and
s
¯
=
∑
i
=
1
m
s
i
m
are the estimates of the long-term process mean and range established during control-chart setup and A
3, B
3, and B
4 are sample size-specific anti-biasing constants. The anti-biasing constants are typically found in the appendices of textbooks on statistical process control.
As with the
x
¯
and R and individuals control charts, the
x
¯
chart is only valid if the within-sample variability is constant. Thus, the s chart is examined before the
x
¯
chart; if the s chart indicates the sample variability is in statistical control, then the
x
¯
chart is examined to determine if the sample mean is also in statistical control. If on the other hand, the sample variability is not in statistical control, then the entire process is judged to be not in statistical control regardless of what the
x
¯
chart indicates.
When samples collected from the process are of unequal sizes (arising from a mistake in collecting them, for example), there are two approaches: